
Summary
- Yields on 10+ Treasuries may rise significantly in 2018.
- Inflationary pressures can be seen in commodities and PMIs.
- Real yields also need to go up as central banks withdraw from the markets.
- These factors combined make us believe yields on 10Y Treasuries will reach 4 to 4.5% in 2018.
This article is an excerpt from our global macro outlook for 2018 we sent out to prospective investors in the first week of 2018. We are laying out arguments that support the bearish case for governmental US bonds due to rising inflationary pressures as as well as real yields. Rising commodities like oil, copper, as well withdrawal of central banks will likely alleviate the term premium compression, which will lead to pickier investors like asset managers, wealth funds and hedge funds filling the void. This, combined with liquidity strain leads us to believe that yields on the 10-Year Treasury bond will reach 4 to 4.5% in 2018, hence having a big impact on portfolios.
There is a number of ways to express this trade like steepeners, outright bond shorting etc. We propose shorting the TLT ETF which tracks longer-maturity bonds or the Junk Bond ETF (JNK).
The 10Y+ treasury yield can be roughly decomposed into two components: inflation and real yield. When it comes to inflation, we have seen the CPI Index advancing to 2.2% in November and hence slowly overshooting FED’s 2% inflation target.
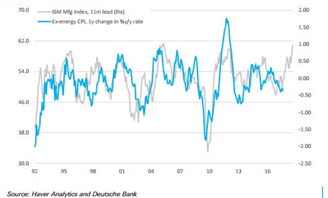
In fact, we have been mentioning inflationary forces building up back in October as manufacturing PMIs surprised investors to the upside, which tend to precede with an 11 month lag CPI ex-energy. (figure 1)
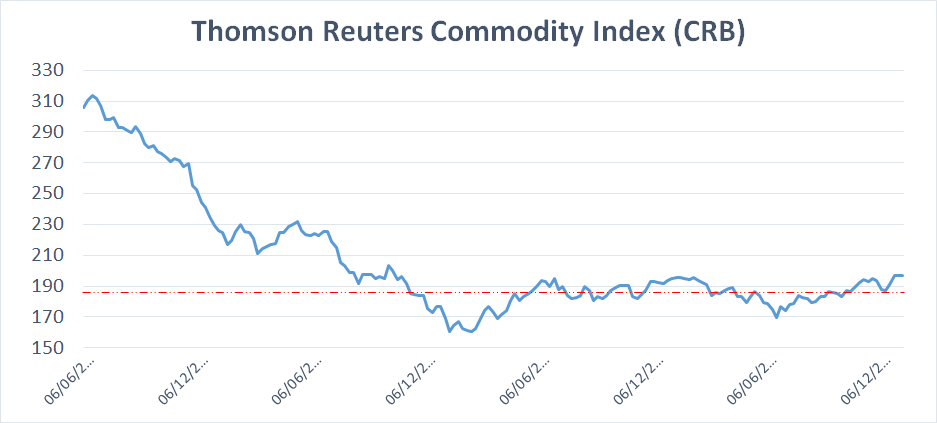
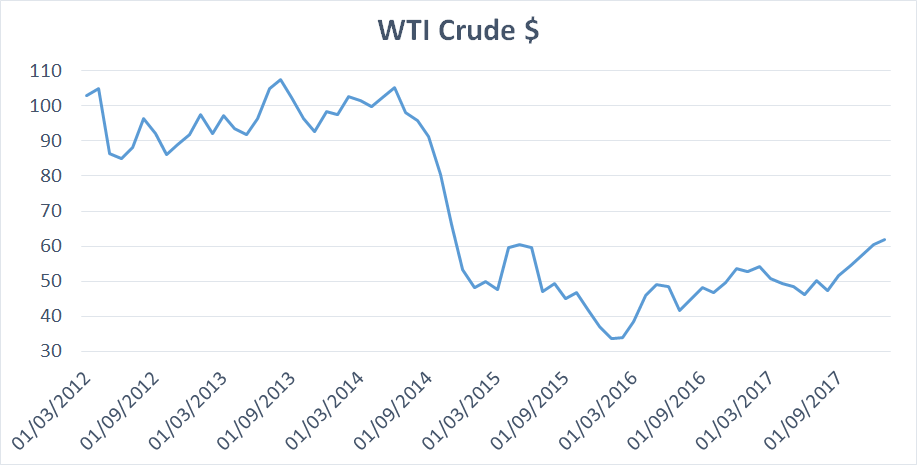
Secondly, we have seen a steady rise in commodity prices (figure 2). A notable example is oil which recently reached 60$ per barrel (figure 3).
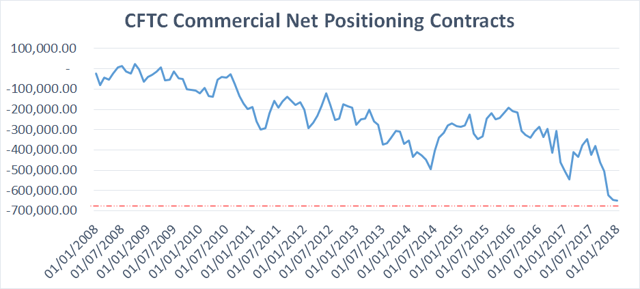
Regardless of whether the price persists, corporates were able to lock in high prices as can be seen from the commitment of traders data (figure 4), which will later on translate into higher inflation.
As we’ve stated in October 2017, rising inflationary expectations will likely be observed around December 2017/January 2018 which will be intensified by the recent passage of the tax bill in the USA.
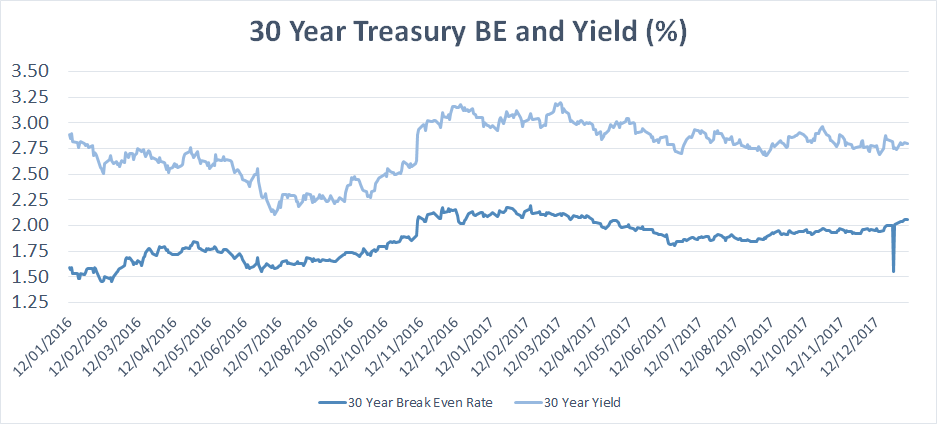
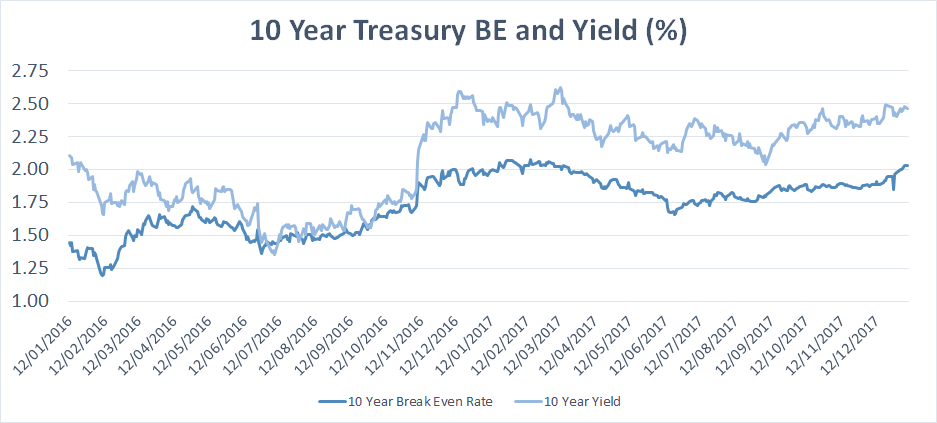
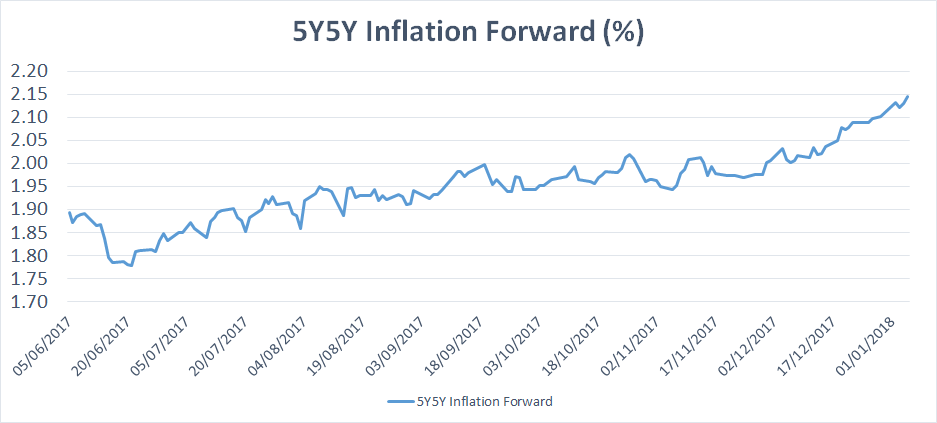
This manifested itself in rising 30Y yields (figure 5), 10Y break-even rates (figure 6) and 5y5y inflation forward (figure 7), which shot above 2%.
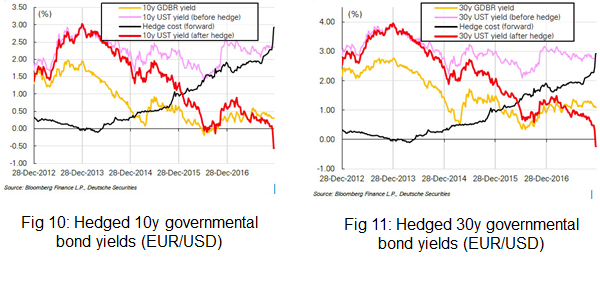
We are also witnessing increased hedging costs for foreign investors willing to buy into US government bonds.
For instance, a European investor willing to buy 10Y US government bonds will actually earn a negative yield after hedging costs (figure 10). A similar situation can be seen in the case of 30Y bonds (figure 11). This will likely continue as the interest differential widens (as seen in figure 12, it is an important factor in calculating hedging costs) and hence make UST less attractive with the current yields. Therefore, real yields need to rise to stay competitive.

One way of expressing this trade is shorting the 20+ maturity TLT ETF or directly shorting governmental bonds.
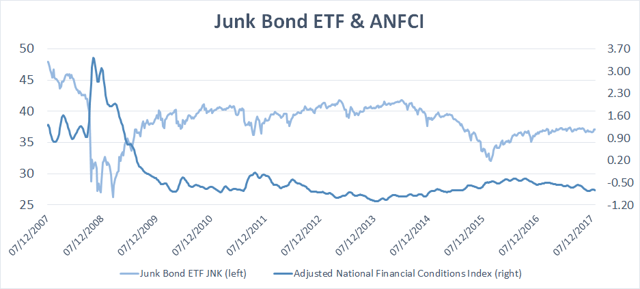
As yields rise, it may have strong implications for junk bonds as well. We therefore advise assessing liquidity via the ANFCI index which tracks tightness/looseness of monetary conditions should governmental yields rise. Rallying ANFCI generally indicates strong tightening and has adverse effects on junk bonds, as can be seen from figure 13.
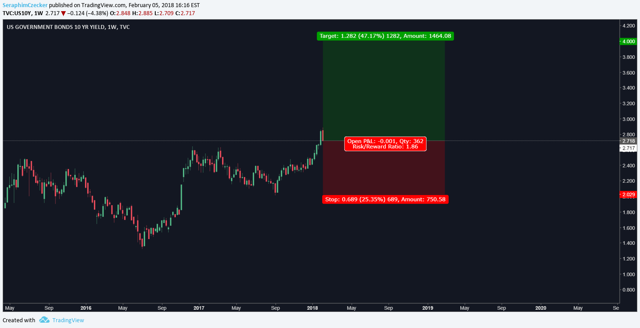
We therefore project a level of 4 to 4.5% yield on 10Y in 2018 due to both rising inflation and real yields bouncing off their lows.
Got different arguments for or against? Let us know and let’s discuss.
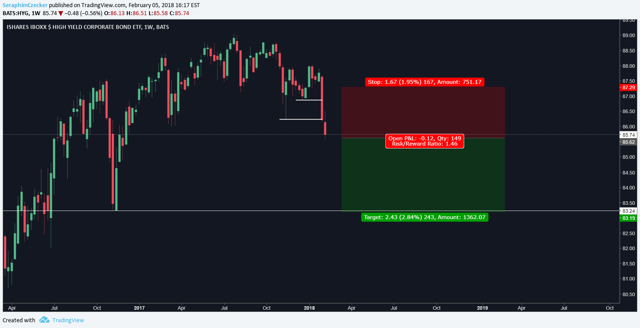
Update 1: We recommended shorting HYG on the 30th of January (date seen on top on the image):
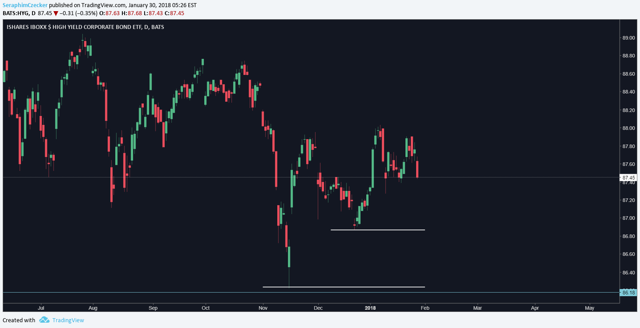
HYG reached out levels, and we are projecting now lower levels for 2018:
Update 2: 10Y yield reached 2.88
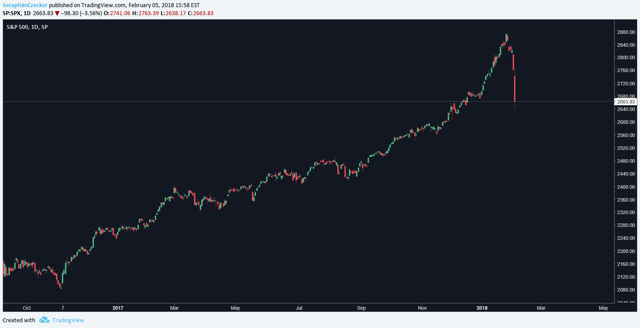
Update 3: Massive selloff in SPX and Emerging markets occurred on the 5th of February amid fears of inflation and 10Y spiking due to 12B of UST expiring from FED’s balance sheet on the 31st January to 1st February and not being reinvested as a part of QT.
S&P:
EEM:
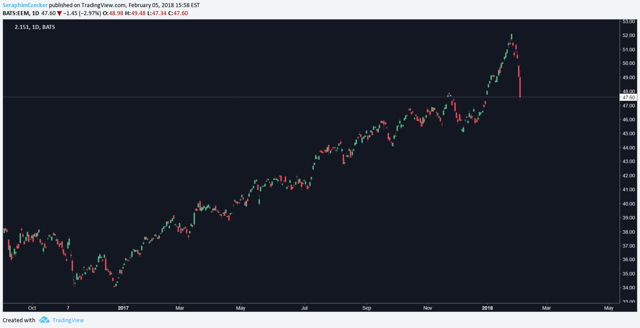
While we do not see a bear market starting in February of 2018, the volatility is likely to rise in 2018.
Disclosure: I/we have no positions in any stocks mentioned, and no plans to initiate any positions within the next 72 hours.