Rising Risks with soaring Mortgage Rates
SHORT: Mortgage Lenders: Mr. Cooper ($COOP) and PennyMac ($PFSI)

Date of publishing: 06.07.2022

Executive Summary

  • WUTIS expects turmoil for Mortgage Lenders with increasing Mortgage Rates
  • The tremendous increase in mortgage rates leads to tumbling mortgage application rates
  • Mortgage Lenders reached astounding valuation levels, fueled by accommodative FED policy
  • This is the first time that the house to income ratio rises, although mortgage rates are also rising
  • The planned policy steps by the FED will lift the mortgage rates even further, with every basis point increasing the pressure on mortgage lenders
  • Mortgage Lenders are already preparing for tougher times
  • Short Position in Mr. Cooper ($COOP) and PennyMac ($PFSI)

Introduction

Current market conditions lead to the question how several business sectors are affected by changing monetary policy and high inflation. Therefore, WUTIS focused on interest rate sensitive sectors and how they react to change. We noticed a strong increase in the 30-year fixed mortgage rate in 2022, leading to a detailed analysis on the US Mortgage lenders markets and the potential downside movement we expect in the sector.

30-year fixed Mortgage Rate [1]

Figure 1: 30-year fixed Mortgage Rate

The following article elaborates on the housing-/mortgage market, implication on this sector from the economic policy, as well as an overview of two mortgage lenders with around 10% of total market share.

Macro-Economic Overview

Housing Market

Ever since the burst of the housing bubble 14 years ago, we have seen a constant appreciation in housing prices around the world.

Case Shiller Index [2]

Figure 2: Case Shiller Index

The problem with the Fed’s intended actions is that monetary policy works with a lag since the transmission mechanism of increasing the fed funds target rate takes time to trickle through to end consumers. One sensible reason for committing to rate hikes is that it wants to adjust inflation expectations. But do we need possibly seven rate hikes to achieve that adjustment? Inflation expectations based on the 5y5y forward inflation rate are hovering at 2%, the Fed’s medium to long term inflation target. This indicator was at its highest in mid-October 2021 at roughly 2.4%.

But it would be short sighted to only consider housing prices without their relation to the income of the US citizens.

Ratio House/Income compared to mortgage rates [3]

Figure 3: House to Income Ratio compared with Mortgage Rates

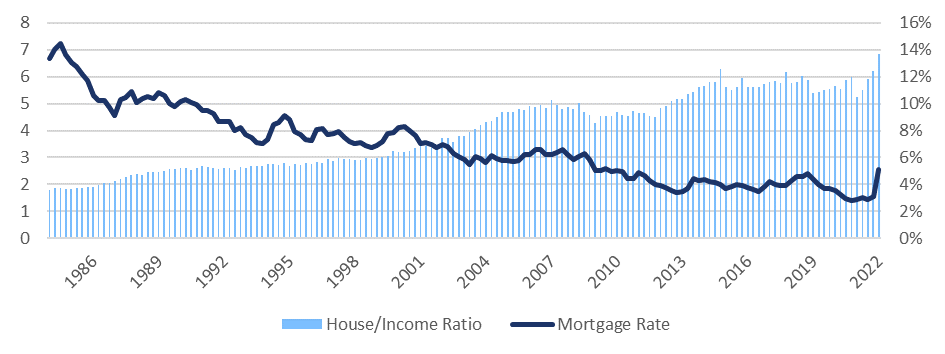
The ratio shows that real estate prices increased at a higher velocity than income. The ratio in 1984 was slightly under 2, indicating that a household needed 2 years to afford a home without any other expenses considered.

We can see that the house to income ratio increased constantly over the years, which indicates that income cannot keep up with rising house prices which means that the purchasing power of households decreased over time.

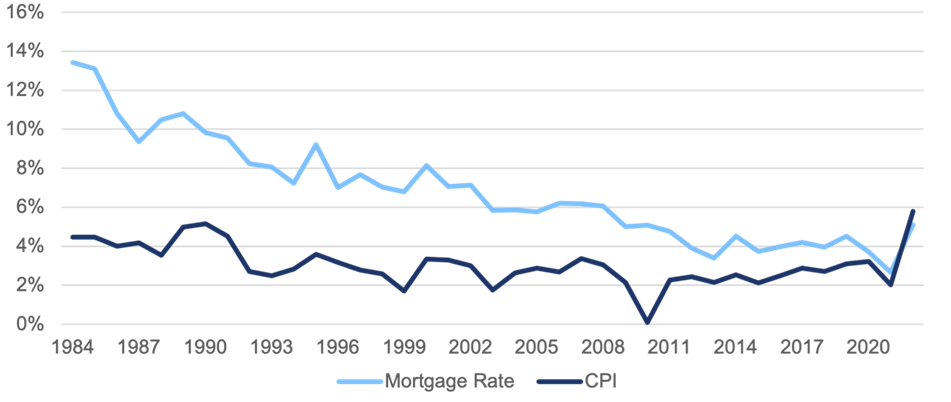
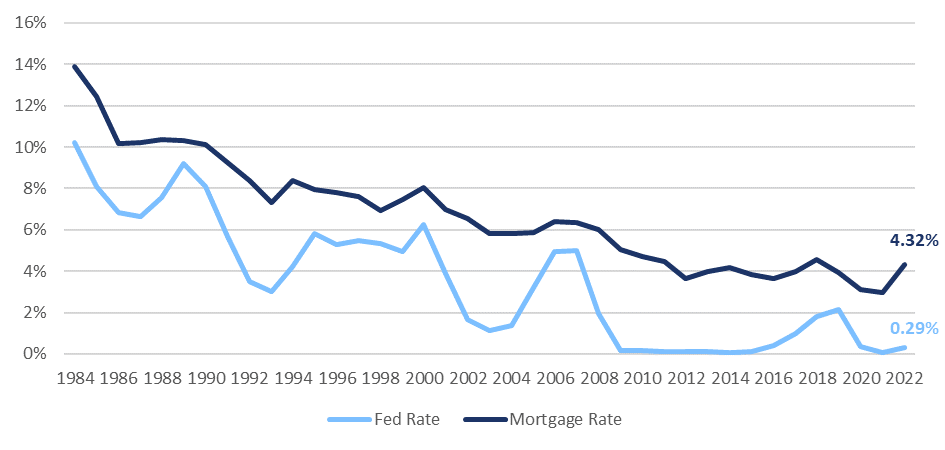
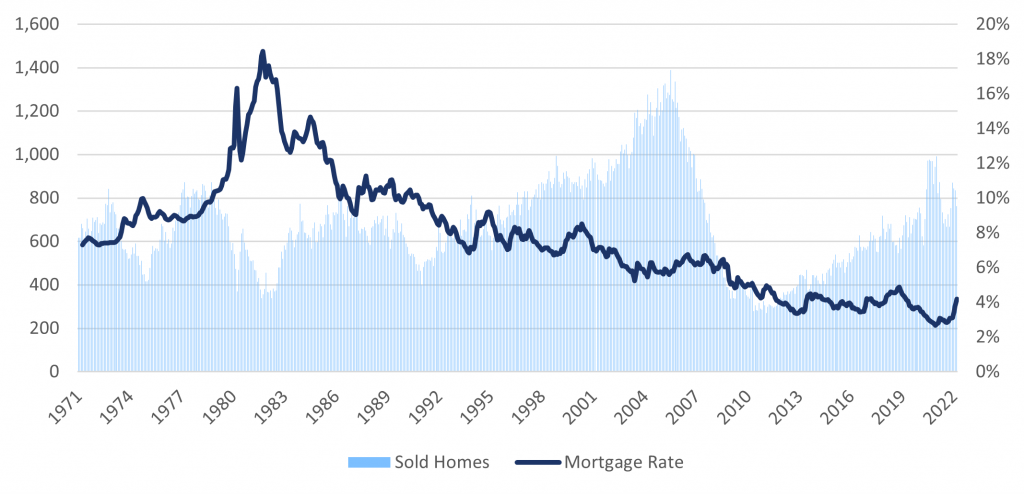
Since the financial crash starting in 2007 the ratio continued its inverse relationship with the mortgage rate to the current level, where an average household needs 6 years to afford a home. As already mentioned, until 2021 we have seen a rather negative correlation, which sounds also intuitive, as declining mortgage rates, make mortgages more affordable, thus demand for housing increases. Right now, the velocity of change significantly accelerated. As a result, private households face higher costs when financing real estate acquisitions.

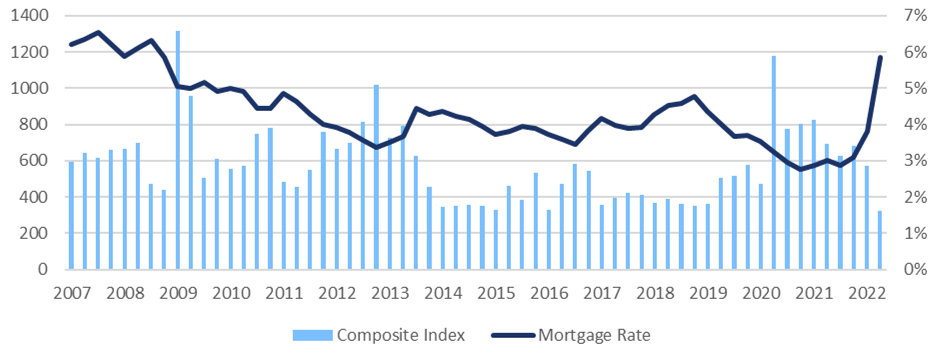
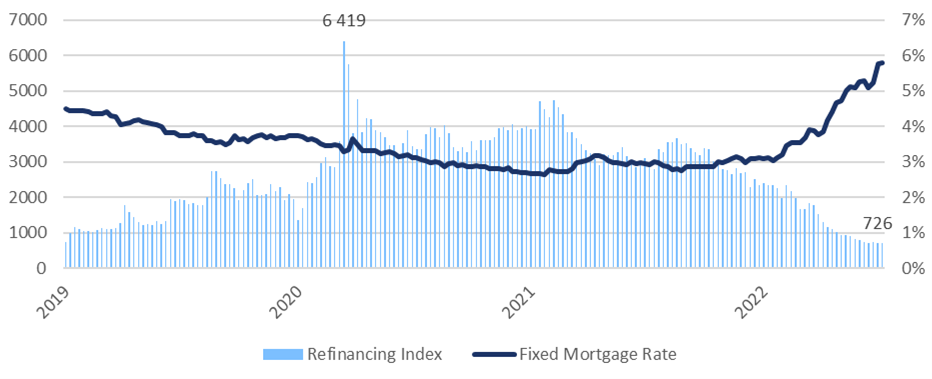
The implications of this development can be already seen in mortgage application numbers.

Mortgage Market

MBA Composite Index plotted with the Mortgage Rate [4]

Figure 4: MBA Composite Index compared to Mortgage Rate
The overall applications show an inverse relation with the mortgage rate and already decreased more than 50% from their top in 2020, which was the second highest notation of the index after 2008. With a rising Fed funds rate, we expect further declines in applications numbers. Therefore, we see shrinking business for the mortgage lending sector, as a substantial part of the business relies[5][6] on origination fees, which is a one-time payment for processing the application when the mortgage contract is signed.

Refinancing Index [7]

Figure 5: Refinancing Index compared with Mortgage Rate
Refinancing Applications are hit even harder than overall application rates. Refinancing only makes sense when the new mortgage is lower than the old rate. Consequently, with rising mortgage rates, there is no incentive to take out a new loan. Important to note is that they made up around 70%[8] of the total applications in 2020/2021.

Profitability of Mortgage Loans [8]

Figure 6: Profitability of Mortgage Loans
Besides the quantity of applications, the profit per loan decreased since its peak of $5,535 in Q3 of 2020. Currently at a level of $233 which is approximately 90% under the average profit per loan over the displayed timeframe. One reason could be increasing costs for mortgage lenders which arise through high inflation.

Share of adjustable mortgages in the overall mortgage market [9]

Figure 7: Share of Adjustable Mortgages and Fixed Mortgage Loans
The proportion of adjustable and fixed rates could also give answer to the question why the profit per loan decreases. Since 89% of all rates are fixed and only 11% adjustable, lenders are not able to adjust the rates to the current mortgage rate in 89% of their granted loans. Thereby, lenders are not much versatile to changing market environments and cannot counteract current inflation levels.

Economic Data

In this chapter drivers of mortgage rates like inflation, the monetary policy by the Federal Reserve, economic growth and the bond market will be discussed.

Inflation

High levels of inflation are putting mortgage lenders under pressure, as inflation erodes purchasing power over time, which consequentially leads mortgage lenders to raise mortgages rates to a level to at least overcome the erosion of purchasing power and to secure net profits.

Mortgage Rate and CPI over the last 40 years [10][11]

Figure 8: 30-Year fixed Mortgage Rate and US CPI
As can be seen in the graphic above the US 30-year fixed mortgage rate always has been on a higher level than inflation, until last year where inflation outpaced the US 30-year fixed mortgage rate. Latest CPI data from May showed an 0.3% increase compared to April and an increase of 8.6% year-over-year. Although CPI decreased on a monthly basis.

Fed Monetary Policy

The Federal Reserve’s monetary policy is one of the most significant factors impacting interest rates and therefore also mortgage rates, which have a 0.97 correlation to the fed funds rate.

During the COVID-19 pandemic the Federal Reserve created excessive amounts of liquidity, with their quantitative easing operations, in order to lighten the consequences of the pandemic. Due to rising inflation and stagnant economic output the Fed started hiking rates in March 2022 by 0.25%. The last hike in June 2022 amounted to 0.75%, the largest increase since 2000, resulting in a Fed funds target rate of 1.5%-1.75%. It is expected that at the end of the year the Fed funds will reach a level of above 3%. The market also prices in a rate above 3% as can be seen in the Fed funds futures. Regarding the meeting probabilities of the Fed, a Fed fund rate between 3% and 3.5% is estimated with a probability of 68%.

Fed Funds Futures [12]

Figure 9: Fed funds futures (as of 07/06/2022)

The Federal Reserve also announced to implement quantitative tightening in order to reduce their $9 trillion balance sheet, they started in June with their first sell-off, including the reduction of mortgage-backed securities by $17.5 billion.

Restricting the money supply is pushing rates higher, including mortgage rates.

Economic Growth

Slowing economic growth (decline by 1.4% Q1) makes it less interesting for individuals to get a mortgage and mortgage lenders need to price in the risk of default, resulting in a further rise of mortgage rates.

In the US, wages have risen with the highest velocity since 2006 due to an extremely tight labour market. Higher wages are also impacting mortgage lenders. Indicated by the employment cost index, from 2001 until 2022 the cost of employment increased, but since 2020 the rate of change surged.

Employment Cost Index [13]

Figure 10: Employment Cost Index 

Bond Market

There is a strong correlation between the 30-year treasury yield and the 30-year fixed mortgage rate. It can be observed that the yield of T-Bonds is most of the time beneath the US 30-year mortgage rate. Although maturities are similar, while mortgages depend on individual payments US treasury bonds are backed by the US government, thus a risk premium is included.

Concluding that the general environment of the bond market, has an indirect influence on how much mortgage lenders charge for mortgages. In the mortgage-backed securities (MBS) market, banks offering these investment products need to provide a competitive yield to attract investors, as government bonds and corporate bonds offer lucrative yields in the long run.

US 30-year Treasury yield and 30-year fixed Mortgage Rate [14][15]

Figure 11: US 30-Year Treasury Yield and 30 Year fixed Mortgage Rate

QUANTITATIVE MODEL

Background

According to the individual committee members’ expectations of the midpoint of the target range, the Fed’s benchmark rate will reach 3.4 percent in December 2022. This hike in the fed funds rate is also reflected in the fed funds futures for December 2022, while the rates in 2023 hover around 3.6 percent.[16] Additionally, the committee projects a rise in the fed rate to 3.8 percent by the end of 2023. With these expected hikes in the fed rate over the following months, there is also a high probability that mortgage rates will continue to rise and put even more pressure on mortgage lenders.

To evaluate the possible impact on the mortgage rate, a Simple Linear Ordinary Least Squares Regression model is initially applied to get an insight into the relationship between the variables. To go beyond this simplistic lens, a Vector Error Correction Model (=VECM) is implemented to meet the needs of the data and find more reliable estimates.

Fed Funds Rate and Mortgage Rate [17][18]

Figure 12: Model Data

The data used for the regression models are the yearly average fed funds rate and the yearly average US 30-year fixed mortgage rate as visualized in Figure 11. The data for both variables has been taken from 1984 to 2022, where the rates for 2022 are calculated using available data from the first half of 2022.

The data used for the regression models are the yearly average fed funds rate and the yearly average US 30-year fixed mortgage rate as visualized in Figure 11. The data for both variables has been taken from 1984 to 2022, where the rates for 2022 are calculated using available data from the first half of 2022.
Table 1: Variable Diagnostics

Simple Linear OLS Regression

The Simple Linear Regression model uses mortgage rates and regresses them against fed funds rates to find a linear relationship between them. The coefficient estimate represents the correlation between the variables, and it might be used to help predict future values of the mortgage rate, but it does not imply a causal relationship.
As shown in Table 2, all parameters of the model are statistically significant and there is a positive relationship between the variables. According to the coefficient estimate, a one percentage point increase in the average yearly fed funds rate would be met with a 0.83 percentage point increase in the mortgage rate, ceteris paribus. Hence, a 3 percent increase of the fed funds rate to 3.3 percent would be matched with a corresponding 2.5 percent rise in the mortgage rates to 6.8 percent, posing an issue for mortgage lenders.
Table 2: Simple Linear Regression Results
Figure 13: Fitted Model
To evaluate the appropriateness of the model and whether the parameter estimates are meaningful, the residuals of the fitted model have to be examined, see Table 3. As expected, there is autocorrelation among the residuals among different time periods, and the variance of the residuals does not remain constant over the entire timeframe, which indicates that there is information left in the residuals that is not accounted for by the chosen model. Interestingly, the model shows a relatively high adjusted R2 value of 0.86, which would imply that the variation in the variable fed funds rate explains 86% of the variation in the mortgage rate. The high adjusted R2 and the statistically significant parameters might have very likely been produced from a spurious regression, where changes in the mortgage rate are incorrectly attributed to changes from the fed funds rate. Spurious regression results are a very common issue among non-stationary time series.
Table 3. Residual Diagnostics OLS Model
To deal with the autocorrelation of the variables and the non-stationarity of both time-series, a Vector Error Correction Model (VECM, a representation of a Cointegrated Vector Autoregressive Model) will be employed.

Vector Error Correction Model

The VECM evaluates both the short-run dynamics and the long-run dynamics between the yearly average fed funds rate and the yearly average US mortgage rate. It is required for this model that the original time-series for the mortgage rate and fed funds rats are both non-stationary and that their differenced time-series are both stationary (refer to Table 1). The differenced time-series simply represent time series of the change in the mortgage rate and the change in the fed funds rate respectively and are the variables that are represented in the VECM notation of the equations. In addition, the fed funds rate and the mortgage rate have to be cointegrated, which means that there needs to exist a linear combination of them that is stationary, thereby suggesting a long-run equilibrium relationship between the two variables. According to the performed Phillips-Ouliaris cointegration test and the Johansen cointegration test with the appropriate lag order, the number of cointegration relationships in the model is one, leading to the rank order of one for the VECM. Using the information criteria AIC, HQ, SC, BIC and FPE the most appropriate model has been found to be VECM of lag order two. In this context, only the equation for the dependent variable mortgage rates (including the long-run equation) is relevant and will be discussed.
Equation Ⅱ. shows how the current change in average annual mortgage rates can be estimated using the Error Correction Term (ECT), which accounts for the long-run dynamic between the mortgage rates and the fed funds rates; the previous changes in mortgage rates one period and two periods ago; as well as the previous changes in fed funds rates one period and two periods ago, with an error term of ε1.
Table 4. VECM Regression Results of Equation Ⅱ.and Ⅳ.

The coefficient estimate of the long-run relationship ECT is negative and statistically significant, allowing the interpretation that the previous periods deviation from the long run equilibrium is corrected in the current period at a speed of adjustment of 2 percent. This confirms the long run equilibrium relationship between mortgage rates and fed funds rates, where the process slowly converges to the long-run equilibrium after short-term shocks.

With regards to the short-run causal relationship between mortgage rates and fed fund rates, it can be concluded that there is a positive causal relationship where changes in the fed funds rate from previous periods cause current changes in the mortgage rate. The coefficient estimates for both lags are positive and the coefficient for the lag of one for the change in fed funds rate is statistically significant. Causality tests including the Wald test have been conducted to confirm these results, where fed funds rate do granger cause mortgage rates. Hence, past values of fed funds rates help predict future values of mortgage rates.
Table 5. Residual Diagnostics VECM
All residual diagnostics speak for the appropriateness of the chosen model, with normal distribution, no autocorrelation and homoscedasticity (constant variance) characterizing the residuals.

Impulse Response from Fed Funds Rate

Figure 14: Impulse Response from Change in Fed Funds Rate

A one standard deviation shock in the change in the error term for the average annual fed funds rate would lead to a 0.3 standard deviation increase in the change in mortgage rates at lag 2. This impact would last to a small degree in the long term, while it is only statistically significant one period after the shock (at lag 2). Additionally, there are no instantaneous changes from shocks in the change in the fed funds rate.

Even though the VECM uses the differenced time-series for the coefficient estimates, requiring some interpretations to be in terms of the change in the rates, the predictions of the VECM model are still conducted for the average annual mortgage rates and average annual fed funds rates. With the expectation that the average annual fed funds rates will be around 3.6 percent throughout 2023 as discussed above, the upper limit forecasts have been used to estimate what the average annual mortgage rate would be. With the upper limit prediction of 3.6 percent for the fed funds rate in 2023, the predictions for the average annual mortgage rate is 5.7 in 2023 and 6.6 percent in 2024. This constitutes a 1.4 percent and 2.3 percent increase from the current annual average mortgage rate respectively. Such mortgage rate increases would put even more pressure on mortgage lenders.

Mortgage Lender

Overview of the Mortgage Lenders

The following two companies should provide a reasonable overview of the mortgage sector and its performance.

Year to Date Performance Mr. Cooper and PennyMac [19][20]

Figure 15: Mr. Cooper and PennyMac share price
Mr. Cooper Group Inc. as well as PennyMac Financial Services Inc. represent the market well with a combined market share of 10.3%.

Market Share [21][22]

Figure 16: Market Share of PennyMac and Mr. Cooper
PennyMac gets a substantial share of its revenues from originations, meaning that they are impacted stronger than Mr. Cooper by declining applications. One quarter of PennyMac’s revenue comes from servicing, under which the collection of interest rates. Mr. Cooper receives almost 50% of it’s revenue from the servicing area. One reason for that is that Mr. Cooper was quite strong in the correspondent area, where they partnered up with other brokerages and for example took over mortgage’s loans, here they receive either no origination fee or have to share it with the respective correspondent. More thorough data on the fundamental performance will be discussed on the following pages.

Share of Revenue [23][24]

Figure 17: Split up of Revenues; PennyMac and Mr. Cooper

Fundamental Findings

As the two companies also, both reported their Q1 earnings we have up-to-date data on how the business is developing and also how the companies themselves look at current developments. Surprisingly Mr. Cooper started to lay off employees in Q1, despite better financial results than their peers, the company stated they are anticipating weaker or rather more difficult quarter coming in this year.

Development of employee count for Mr. Cooper Corp. and Pennie Mac Financial Inc. [25][26]

Figure 18: Count of Employment PennyMac and Mr. Cooper
Both companies increase their employee count in the recent years, especially PFSI had an increase of over 50% from 2020 to 2021, which can mostly be explained by a substantial increase in mortgage demand due to accommodative fed policies in the respective years. But this could also bear a high risk for PennyMac. We see a similar increase for Mr. Cooper the only change is the drastic decrease from 9,800 employees to 8,200.

Financial Health

Although these developments are already catching some interest, there is definitely more to find when by looking at the financial statements.

The so to speak father of value investing, Warren Buffett, has many different ratios he likes to look at, but one of the most important ones in his opinion is the Return on Equity (ROE) and especially the development over the years. Telling the investors how profitable their funds are invested.

Development of Return on Equity Ratio [27][28]

Figure 19: Return on Equity PennyMac and Mr. Cooper
The chart shows the development of the ROE which experienced slight decreases for Mr. Cooper, but the constant decrease of the ROE of PennyMac is note worthy. With a decrease of over 50% in just one year the ROE ratio for PennyMac could be a signal for distress within the sector. Furthermore PennyMac had to experience similar developments with their production segment pre-tax income..

Production Segment Pre-Tax Income PennyMac: [28]

Figure 20: Production Segment Pre-Tax Income PennyMac

The development of a decrease of 90%, just from Q4’21 to Q1’22, can be immediately noticed, the decrease looks even more worrisome of you have a look at the year-over-year development. Which decreased from $380 million to just $9 million. The reasons for that, according to PFSI, have been substantial decreases of margins as well as diminishing volumes.

Speaking of funded volume Mr. Cooper shared in their recent report data of the development of it’s mortgage volumes they have funded in the recent quarters.

Funded Volume (in billions) by Mr Cooper [29]

Figure 21: Funded Volume Mr. Cooper
Again, a sharp decline can be observed. What is noteworthy is the decrease in funded volume of 72% for the correspondent segment, which is the business area where Mr. Cooper cooperates with other mortgage lenders and brokerages.

Conclusion

Our expectation for a declining business for the respective companies as well as the overall mortgage sector is mainly based on the fact that overall Mortgage Applications already declined to 2019 levels. One of the reasons for that is the dramatic decline in refinancing’s which made up around 70% of all applications in 2020 and 2021. Showing the significance of this part of the applications which reacts more sensitive to mortgage rate changes, as these consumers already have a mortgage and a home therefore the only reasons for a refinancing would be to get a better deal.

PennyMac [30]

Figure 22: PennyMac Stock Chart

Mr. Cooper. [31]

Figure 23: Mr. Cooper Stock Chart
In both charts the Covid lows are marked, indicating a potential point at which the stock price could fall to. One of the reasons for that is that the 2020 sell-off was mainly pricing in significant losses of business as well as more risks in the housing market, but during this period the Fed policy turned the market environment upside down and provided mortgage lenders with the most beneficial policy environment during a time where demand for housing increased as well.

Monthly home sales [31] (in thousand)

Figure 24: New monthly sold home (1000s) in the US
We can see the significant impact Covid had on the housing market. As pointed out, the house to income ratio was steadily increasing over the years, but until this year the rise was accompanied by falling mortgage rates, though this fertile environment was impacted early 2022 by the new stance of the Federal Reserve toward the inflation as well as the policy change which came with it.

Disclaimer The information set forth herein has been obtained or derived from sources generally available to the public and believed by the authors to be reliable, but the authors do not make any representation or warranty, express or implied, as to its accuracy or completeness. The information is not intended to be used as the basis of any investment decisions by any person or entity. This information does not constitute investment advice, nor is it an offer or a solicitation of an offer to buy or sell any security. This report should not be considered to be a recommendation by any individual affiliated with WUTIS – Trading and Investment Society e.V.

Close Menu