Profiteers of a booming Energy Market
LONG: iShares U.S. Oil Equipment & Services ETF ($IEZ)

Date of publishing: 02.02.2022

Executive Summary

  • WUTIS expects investments in the Oil & Gas industry to increase in 2022
  • High profitability of Crude Oil wells, elevated political tensions and ongoing inflation concerns point to further increasing Oil Prices
  • Oil Producers and Equipment Manufacturers recovered 2020 demand gap throughout 2021
  • Long Position in iShares U.S. Oil Equipment & Services ETF ($IEZ) and individual holdings $SLB & $BKR

Introduction

In times of rising political tensions and heightened volatility in financial markets, WUTIS has identified an opportunity to capitalize on. With current developments in the Oil & Natural Gas markets, powered by increasing profitability of on-going projects and high lucrativeness of new crude oil wells, we believe that an acceleration of investments in the Oil & Gas sector is imminent. Therefore, we take position in the iShares U.S. Oil Equipment & Services ETF ($IEZ). An ETF consisting of companies, producing equipment or offering services to oil and gas companies. Holdings in the ETF are direct beneficiaries of the increasing profitability in the fossil fuel sector.

Market Environment

COVID-19

The impact of COVID-19 continued to stir up the energy markets in 2021. While in early 2020 consumption and production of crude oil and refinery products fell sharply in response to the throttled demand, markets saw a steep recovery towards the end of 2020. With the vaccination roll-out, we have seen a consistent recovery of global consumption throughout 2021, resulting in an increase of 5.17% in global oil consumption from the previous year, yet still 1.09% below 2019 levels. The consumption and production graph show that a supply surplus is expected in Q1 of 2022.
Figure 1 World liquid fules and global demand

As global consensus grows on the Omicron-variant occuring milder than previous variants, the prospects of global oil markets are promising. Additionally, current reports did not factor in a higher demand as the Energy Information Administration (EIA) was expecting demand declines due to the beginning uncertainty with the emergence of the variant, still negatively accounted for in the consumption and production graph above. [1]

Declining Storages

Over the past months, US-inventories of Crude Oil were shrinking to 5y-lows. Supply Shortages since 2020 caused the storage levels to decline in order to meet the revived demands fuelled by increasing travel and overall mobility and offset the supply shortages.
Figure 2 US Crude Oil Inventories
Therefore, we can expect that once supply exceeds demand again, effects on the oil markets will not promptly impact markets as most of the surplus will be utilized to refill inventories, surplus will only hit markets after inventories are full. [2]

Crude Oil Demand and the US-Dollar

Risk for the demand side is the now strengthening US-Dollar, putting Emerging Markets under pressure and followed easing in oil demand. Not only less demand from the Emerging Markets, but also the inverse correlation of the Dollar to oil prices are a risk we account for. As Oil Commodities are valued in USD, the fluctuations of the currency pose an essential risk for the thesis.
Figure 3 Inverse Correlation Crude Oil WTI & DXY

OPEC

Following the conclusion of the 24th OPEC and non-OPEC ministerial meeting on December 2nd 2021, the decision is to adjust upward the monthly overall output by 0.4mb/d by February 2022 until all production cuts are reversed.[3] While this may increase the oil supply in the market, oil consumption is still outpacing oil production. On top of that, with the ongoing oil production outages in Libya, struggling production recovery in Nigeria and reduced expectations for Russian production in case of political sanctions, we do not expect oil supply to be in surplus anytime soon.[4]

Inflation Rates

The correlation between inflation and oil prices were much more evident in the 1970s than today. While correlation isn’t as strong as before, it still serves as an important indicator. St. Louis Fed estimates a correlation of 0.27 between changes in oil and CPI.[5]
Figure 4 Oil Price and US-Inflation Rate
Overall prices climbed 7% year-on-year, its highest level since June 1982. The FED looming rate hikes may not be enough to combat the high inflation rates, as sources of inflation involve supply chain bottlenecks. With this, we expect the inflation rates to remain and/or increase.[6]
Figure 5 Crude Oil WTI and 5y5 Forward Inflation Rate
The 5y5y Breakeven Rate models the long-term inflation expectations and, as with most of the natural resources, we also see a positive correlation of WTI Futures with the inflation proxy.

Political Landscape

Russia/Ukraine

Russia as a commodity powerhouse influences the oil market significant. On the verge of an escalating conflict between Ukraine and Russia, we’ve seen increasing movement in the market. Although sanctions from the West against Russia would be expected in the case of Russia invading Ukraine, this may not be the case as it would harm the West. But even if left sanctionless the market would remain in uncertainty. A strong reaction would lead to a significant tightening in energy and agriculture markets. Russia is not only the second-largest oil producer but also the second-largest crude oil exporter. Thus any sanctions will push the global market into a deficit and drastically increase our bullish outlook. With the decision of OPEC to increase output from the first quarter of 2022 the question arises whether such increase would have an strong impact prices. As the increase is expected to be at 400,000 barrels a day ,a significant impact is not to be expected.[7]
Figure 6 Russian Share in global Crude Oil exports
Figure 7 Russian Crude Oil exports by destination

Iran nuclear deal

The Biden administration pledged to revive the Iran nuclear deal. However, as circumstances have changed and it is expected that a less robust, compromised deal to be settled.[8] The reason behind this is strongly political as Biden’s unpopularity is surging and something as little as a bad nuclear deal might help increase his popularity again. One of the drivers of his unpopularity are the high oil prices in 2021 (Brent Crude Oil’s 2021 average spot price at $71 a barrel compared to $42 a barrel, in 2020).

Due to US sanctions, Iran was exporting at historic lows of less than two million barrels a day in 2020. Thus, reserves as high as 120 million barrels are expected to be able to be brought to the market almost immediately, which poses one of the major risks to our trade as we assume that unlike the OPEC’s supply increases this risk is not priced in yet. Furthermore, Iran has already announced to scale up production back to 4 million barrels a day as soon as this spring. With the OPEC+ routinely falling short of the needed supply, Iran could lower global prices up to 10%. This might also explain the White House’s silence on Iran’s compliance.

Fundamental Analysis

Crude Oil Demand and the US-Dollar

Oil Price: 88.15 (31.01.2021)
Figure 8 Crude Oil WTI Front Month Contract

Cost of Production

The current cost of production of a barrel of oil is at 50.85 USD for new wells and 28.28 USD for existing wells, this leads us to the assessment that oil companies are operating with increasing profitability. We conclude that at the current oil price levels it is lucrative for the oil companies to emphasize investing into new projects, for the last 2 years approaching new wells wouldn’t have been a cost-effective operation.[9]
Figure 9 Cost of Production per Oilfield

Oil Companies

We decided to look at Exxon Mobil($XOM), BP($BP) and Royal Dutch Shell($SHEL) as they are some of the biggest oil and gas producers worldwide.
Figure 10 Earnings Dates
Figure 11 Revenue 2017-2021
Figure 12 Earnings per Share 2017 - 2021
In 2021 Exxon Mobil had its best financial year since 2018, as well as Royal Dutch Shell, which almost earned the whole 2020 revenue until Q3 in 2021. The only one who couldn’t catch up is BP, but we see by looking at the EPS that all 3 of them are profitable again. This will provide capital for new oil and gas projects. The expected earnings for 2021 are showing that the market is also expecting fabulous results, and Exxon Mobil already proved them right with reported Q4 EPS of $2.08 instead of $1.77 expected.

Holdings of the iShares U.S. Oil Equipment & Services ETF ($IEZ)

Figure 13 Holding of $IEZ and EPS per Holding

(Schlumberger, Baker Hughes and Halliburton already reported 2021 Results)

We can see that all Holdings of the $IEZ show a positive EPS growth from 2020 to the Q3 2021. As the current earnings season is ongoing, we will further monitor their outcomes, but expect overall positive releases, as well as further stabilizing results of the oil and gas equipment and service industry.

Although, we should not neglect previous years, many of these companies have not been profitable. One of the reasons could be the reduction of liabilities. 9 out of the 11 biggest holdings (accounting for around 82% in $IEZ) have significantly reduced their debt level from 2020 to 2021. On average, by 13.38%.

Figure 14 Total Liabilities of $IEZ Holdings

Correlation

Figure 15 Correlation $IEZ & $USO
If we compare $IEZ with the United Stated Oil Fund LP ($USO) tracking oil prices, a correlation of 0.87 is measured. As we also expect rising oil prices, this gives us another basis for our bullish outlook on $IEZ.
Figure 16 Correlation $IEZ and Crude Oil WTI Front Month Contract
Comparing $IEZ with the WTI Crude Oil Front Month Contract ($CL.1) we can see a current correlation of 0.9.

Schlumberger NV and Baker Hughes Co

We also want to take a quick look at the two major holdings of the $IEZ, Baker Hughes ($BKR) and Schlumberger ($SLB). Accounting for 44.63% of the ETFs Holdings.
Figure 17 $BKR and $SLB 2017-2021
After Q4 releases both companies have had exceptional developments. $SLB had one of its first positive years again, while reducing its debt by 12.42%. $BKR is near to be profitable with an astonishing increase in EPS while also decreasing its debt by almost 6% although, revenue stayed at 2020 levels.

Trade Strategy

To achieve the desired exposure in the iShares U.S. Oil Equipment & Services ETF, the first trade consists of simply buying OTM Calls. With $IEZ closing at $15.67, it is still trading underneath its pre-Covid price levels by 25%. Therefore, and because of the other arguments mentioned in this article, our price prediction is above $20. The setup of this trade is buying calls with the strike of $19 and expiration on July 15th 2022. With a price of $85 per contract, buying 10 calls in total for a price of $850, while these $850 at the same time represent our maximum loss. The R:R is 1,5. The current delta for our exposure is 0.28. The implied volatility is currently at 49.2%. Also, interesting to watch is the 52-week IV percentile, which is currently at 12%, meaning that in 52 weeks 12% of the time the IV has been lower than 49.2%. With that in mind, a rise in volatility seems likely. As can be seen in the picture below, the breakeven point is at $19.85. If $IEZ is trading at $21 at expiry, profits would be as high as $130 per contract and yielding $1300 in total.
Figure 18 Long IEZ-15Jul22-19-C P&L Chart
Figure 19 IBKR Option Chain 15-Jul-22

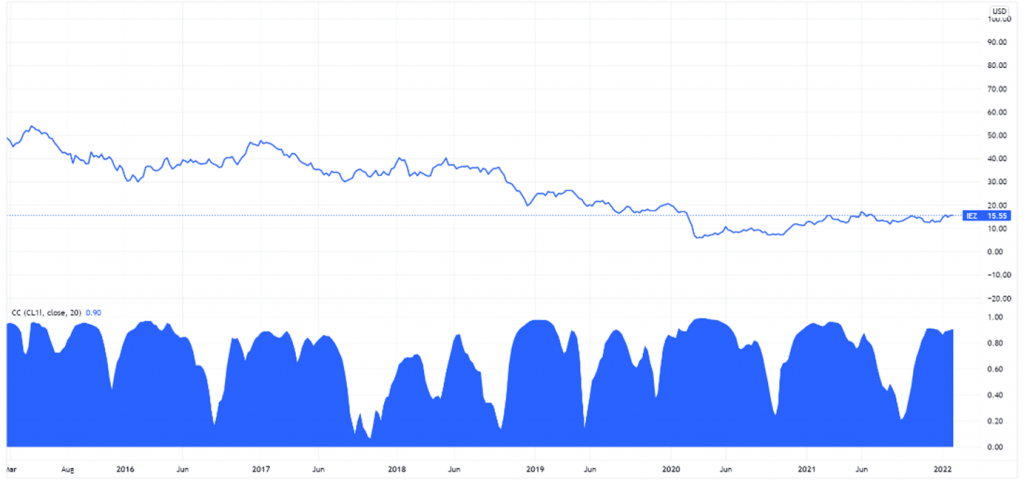
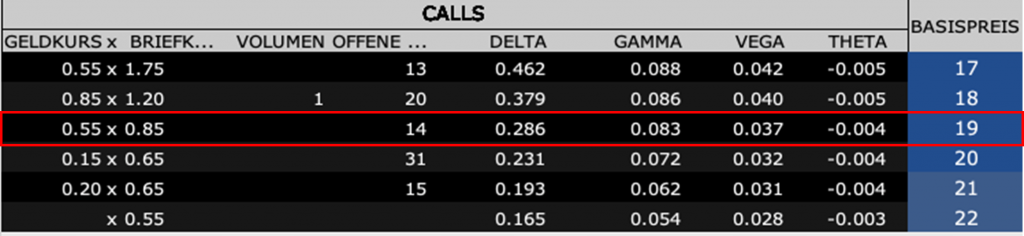
For the ETF, only buying OTM Calls seem of interest to us. Visible in the option chain, traded volume and open interest on $IEZ are extremely low, entering a suboptimal market with regards to liquidity. As the risk is to enter the trade at an unportioned high price, more complex strategies like a calendar spread or a diagonal spread currently do not present a way to trade this underlying at the moment. Consequential the profit/risk ratio is not lucrative enough, paying out low premium and coming with higher potential losses.

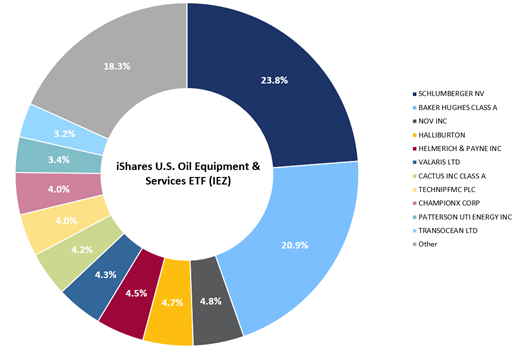
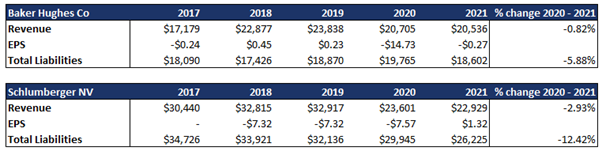
Nevertheless, as Schlumberger ($SLB) and Baker Hughes ($BKR) make up a significant share of the ETF, we also take a position in these holdings to support the thesis. 

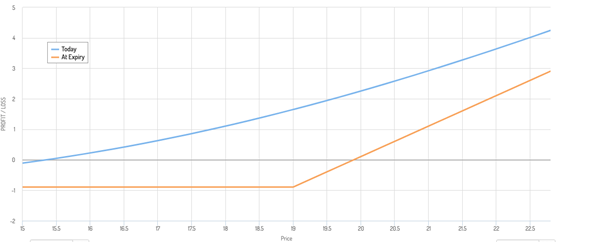
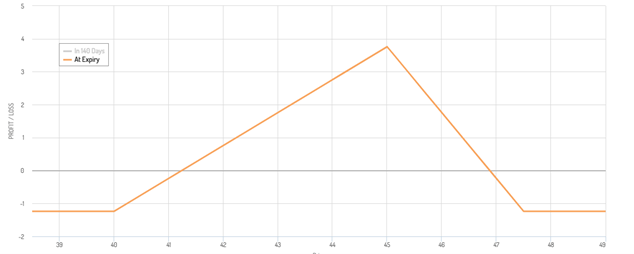
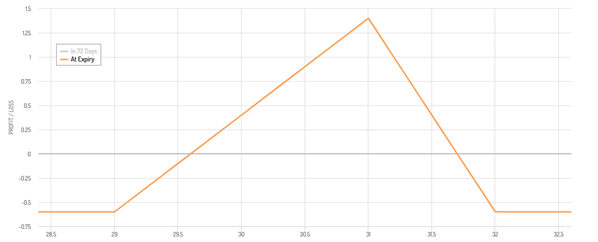
Both have more favourable volume and open Interest compared to $IEZ. Therefore, a more exotic trading strategy might fit. Christmas Tree Butterfly with calls, consisting of a long call, three higher positioned short calls and two long calls above the three sold calls. Similar to standard butterfly spreads yet giving the strategy a bullish directional exposure.

$SLB closed at $39.07. Trading the June contract (expiry: June 17th 2022), a long call at $40 with a delta of 0.53, three short calls at $45 with a delta of 0.35 and two long calls at $47.5 with a delta of 0.27. The implied volatility is at 43.6%. For this setup, a premium of $140 needs to be paid. The maximum profit is as high as $382. This results in a R:R of 2.7.

Figure 20 $SLB Christmas Tree Butterfly June 17 2022 Contracts

$BKR closed $26.90. Setting up a Christmas Tree Butterfly with calls for the April 14th 2022 contract, Long call at 29 with a delta of 0.395, Short three contracts of the $31 calls with a delta of 0.25 and Long two calls at $32 with a delta of 0.194. The implied volatility is at 40.9% whilst the historic volatility is above the current IV at 45.3%, meaning that option prices might be discounted. Debit paid for this trade is $60. The maximum gain is $140, resulting in a R:R of 2.3.

Figure 21 $BKR Christmas Tree Butterfly April 14 2022 Contracts

References

Disclaimer The information set forth herein has been obtained or derived from sources generally available to the public and believed by the authors to be reliable, but the authors do not make any representation or warranty, express or implied, as to its accuracy or completeness. The information is not intended to be used as the basis of any investment decisions by any person or entity. This information does not constitute investment advice, nor is it an offer or a solicitation of an offer to buy or sell any security. This report should not be considered to be a recommendation by any individual affiliated with WUTIS – Trading and Investment Society e.V.

Close Menu