Denmark's Economic Triumph
Unravelling a Tapestry of Potential
Date of publishing: 07.08.2023
Executive Summary
- Denmark’s political, legal and demographic environment has fostered economic stability and growth and will most likely lead to a continued competitive advantage
- The Danish stock index OMXC 25 has shown incredible performance over the last 5 years, significantly outperforming the Eurostoxx 50 and keeping up with the S&P 500
- Current trends in sustainability and macroeconomic factors (interest rates, unemployment, etc.) paired with low valuations on the stock market create attractive entry opportunities for investors
- We rated the 100 biggest equities listed on the Copenhagen exchange in order to derive with a portfolio shortlist, ultimately choosing 13 long and 3 short positions.
- Through quantitative portfolio optimization with implemented derivative strategies, we aim to exploit the valuation possibilities and create alpha by maximising Sharpe ratio
Introduction
Denmark, a country of rich and successful history, has a captivating past that dates back to 500 AD when the Danes first settled in the region. The Danish nation proudly boasts the oldest flag in the world, the revered “Dannebrog,” acknowledged in 1219. Nestled in the North Sea and sitting between Germany and Sweden, Denmark’s exceptional geography, with no point on land farther than 50 km from the coast, has been instrumental in fostering early economic growth.
Spread across 444 islands, modern Denmark encompasses an area of 42,920 km2, providing a compact yet diverse canvas for its 5.86 million inhabitants. Renowned for their contentment, the Danish people rank as the second happiest population on earth. The majority of them find their abode in Copenhagen, the thriving capital that serves as the nation’s political and economic epicentre. In the midst of the city, the “Nationalbanken”, Denmark’s central bank, keeps watch over the $398.3bn in GDP, trying to prolong the strong growth that the economy has seen in recent years.An Overview of Denmark

Macroeconomic Analysis
Denmark boasts a stable and prosperous macro environment. With a thriving job market, the country has 2,882,000 employees. Impressively, Denmark’s unemployment rate stands at just 2.4%, a remarkable achievement that places it below the European Union’s average. This low unemployment rate reflects Denmark’s strong economic foundation and effective labor market policies.
Unlike many countries with statutory minimum wage laws, Denmark follows a unique approach to wage determination. The country has no statutory minimum wage, relying instead on collective bargaining between labor unions and employers to set hourly wages. This negotiation process has resulted in an average hourly wage of almost $33, providing workers with fair compensation and promoting a harmonious relationship between employers and employees.
One standout feature of Denmark’s macro environment is its equitable wealth distribution. The Gini Index, which measures income inequality, stands at 27.5. This low score demonstrates that Denmark’s wealth is evenly spread across its population. The nation’s commitment to social welfare policies and progressive taxation plays a significant role in achieving this balanced wealth distribution and sets it apart as an example of inclusive growth among developed countries.Sectors of Denmark's Economy
Green Transition
Trade Partners
An Overview of Denmark

What makes Denmark stand out?
National Debt in % of GDP

Economic Indicators
Real GDP

PESTEL Analysis

Stock Market Overview
Stock Market Performance for different Indices

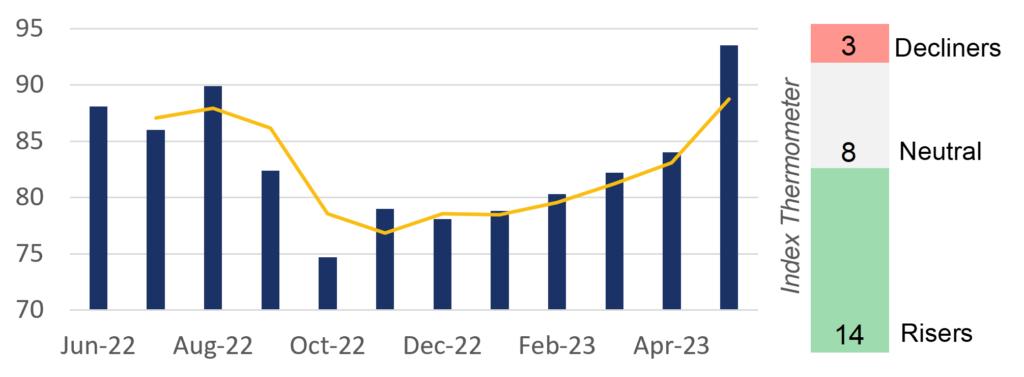
Economics Sentiment and Index Thermometer of OMXC 25
OMXC 25 historical Price-to-Earnings Ratio

Portfolio Construction
Constructing our portfolio involved a thorough approach, driven by the goal of creating a diverse collection of Danish equity positions with the highest potential for success. Our task began with a comprehensive selection process, where we carefully handpicked the 100 largest companies listed on the Copenhagen Stock Exchange (CPH). These companies were chosen based on their market size and prominence, making them perfect candidates for further evaluation.
Next, we conducted an extensive qualitative assessment across six categories – Overall Business, Macro Environment, News, Competitors, Management, and Financials – leaving no stone unturned in order to verify the suitability of each company for inclusion in our portfolio. This evaluation allowed us to gain a deep understanding of each company’s strengths and weaknesses, helping us to make well-informed decisions.
Within each category, we assigned rankings on a scale of 1 (signifying the least favorable) to 6 (signifying the least favorable to the most favorable performance). These rankings served as valuable benchmarks, helping us identify the most promising candidates. Furthermore, shortlisting companies that excelled in key areas and identifying those that fell short of our expectations was a crucial step in our process
To ensure risk management and portfolio balance, we established discretionary weight boundaries for both long and short positions. This strategic allocation of resources allowed us to maintain a well-diversified portfolio, minimizing our exposure to any single company, therefore enabling us to mitigate potential risks while aiming to maximize returns
Furthermore, we employed advanced portfolio optimization techniques, with a particular focus on maximizing the Sharpe ratio – a measure that considers the risk-to-reward tradeoff. This ratio guided our decision-making process, helping us strike an optimal balance between potential returns and associated risks within our portfolio.
In our pursuit of enhanced profitability, we implemented an option strategy. This involved skillfully utilizing options contracts to leverage our positions, potentially amplifying returns. By carefully analyzing market conditions and employing suitable options, we aimed to capitalize on favorable opportunities and optimize our profits.
In conclusion, constructing our Danish equity portfolio was a complex and thorough process. Through a comprehensive evaluation process, careful shortlisting, robust risk management, portfolio optimization, and profit leveraging strategies, we aimed to create a resilient portfolio with the highest potential for success. Our diligent approach was designed to position us for long-term growth and enable us to capitalize on the diverse opportunities presented by the Danish equity marketQuantitative Optimization
In the world of finance, investors are constantly seeking strategies to optimize their portfolios and maximize returns while effectively managing risks. One widely recognized approach is quantitative portfolio optimization, a systematic process that employs mathematical models and statistical analysis to construct an ideal portfolio allocation. Our quantitative portfolio optimization process is centred around the Sharpe ratio, a popular risk-adjusted performance measure, to help us achieve better weight allocation of our portfolio.
The Sharpe ratio evaluates an investment’s return in relation to its risk. It provides a quantitative measure of the excess return achieved per unit of risk taken. The ratio is calculated by subtracting the risk-free rate of return from the investment’s average return and dividing the result by the investment’s standard deviation. A higher Sharpe ratio indicates a better risk-adjusted performance.
The first step in the portfolio optimization process is to gather historical data for the selected stocks. Our data includes price and return information from 2018. This time horizon is preferred because it captures various market conditions and accounts for potential correlations among assets. Using the historical data, expected returns and standard deviation for each asset are estimated. Various methods can be employed, we used the mean-variance optimization because it is important to consider both the asset’s standalone risk and its contribution to the overall portfolio risk. The Sharpe ratio is computed for each asset using the estimated expected returns, risk free rate and risk measure. This step allows for the comparison of different assets on a risk-adjusted basis. Assets with higher Sharpe ratios are considered more attractive, as they offer a better trade-off between risk and return. To construct the optimal portfolio, we utilized a constrained optimization. Our objective is to maximize the portfolio’s overall Sharpe ratio, subject to the defined single weight constraints. This process involves adjusting the portfolio weights allocated to each stock to achieve the desired risk-return profile.Portfolio Allocation and Performance
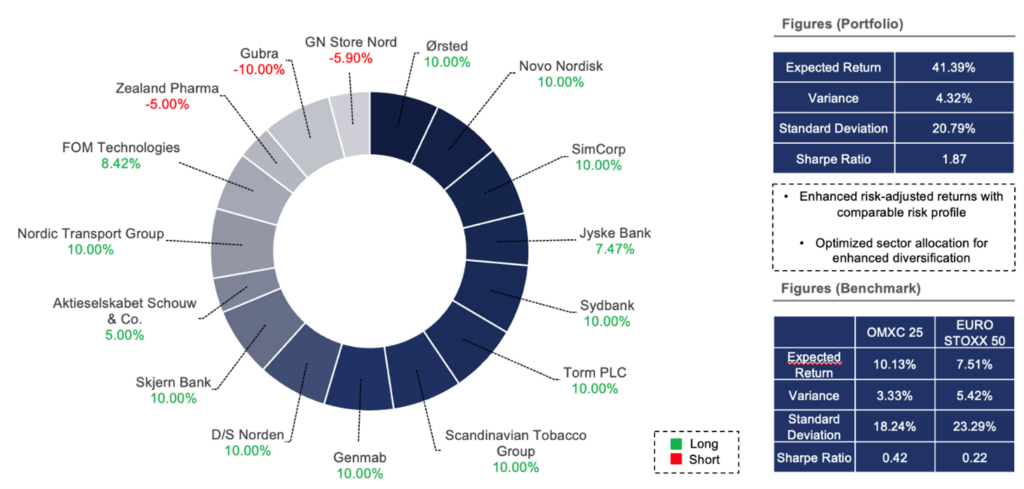
Our optimized portfolio yielded promising results, demonstrating the potential for improved performance compared to the benchmark. By employing this methodology, the portfolio was fine-tuned to achieve a favourable risk-return profile, leading to enhanced returns with similar risk.
The optimized portfolio exhibited several notable outcomes. Firstly, the portfolio’s asset allocation was strategically adjusted, considering the individual stock weights ranging between 5% and 10% (-10% to -5% for the short positions). This ensured diversification while maintaining an optimal level of exposure to specific stocks.
Additionally, diversification helps to reduce the impact of individual stock volatility on our overall portfolio performance. Furthermore, the portfolio optimization process effectively maximized the Sharpe ratio, resulting in a risk-adjusted return that surpassed the benchmark.
It is important to note that the performance of the optimized portfolio may vary over time due to changing market conditions. Regular monitoring and periodic rebalancing might be necessary to ensure the portfolio remains aligned with the desired risk-return objectives. By proactively managing the portfolio, investors can adapt to evolving market dynamics and potentially sustain outperformance over the long term.Options Strategy
We stepped up and considered that derivatives should serve us perfectly when it comes to profiting from a directional move. To minimize risk, we just chose options for four stocks. Our team of analysts tried to keep it simple with the strategy, as the Danish options market Is not as liquid as some others. Therefore, we had to take what was given end decided to short puts for 3 long positions and 1 short call options for short positions. Goal is to collect extra premium form those positions, to accelerate profits, with a reasonable risk to reward.
Additionally, diversification helps to reduce the impact of individual stock volatility on our overall portfolio performance. Furthermore, the portfolio optimization process effectively maximized the Sharpe ratio, resulting in a risk-adjusted return that surpassed the benchmark.
As we have rational stop levels, we simply cover our short option positions, risk is minimized and cannot get out of hand, as short positions in derivatives can end badly with unlimited losses. For those levels we used pricing of underlying stocks that should not be reached under normal circumstances. Novo Nordisk for example has a stop at the pricing level, shortly before the breakthrough overweight/obesity drug was announced.Implementation
To enhance our investment portfolio and potentially generate additional income, we have implemented a long/short strategy involving options. Our approach entails selling put options for three long positions and call options for one short position. This strategy allows us to collect option premiums, which can significantly boost overall returns while aligning with our general investment idea.
We’ve chosen Novo Nordisk as one of our options targets. The short put option for Novo Nordisk has an expiration date of 8th December 2023, providing us with a timeframe of 167 days. The current spot price is 1093.2 Kr., and the premium we’ve collected is 16,630 Kr.
Similarly, the short put option for Jyske Bank also has an expiration date of 8th December 2023. The spot price for Jyske Bank stands at 542.8 Kr., and we’ve collected a premium of 1,611 Kr.
For Ørsted, the short put option has an expiration date of 8th December 2023, with a spot price of 574 Kr. The premium collected is 19,625 Kr.
Our analysis of GN Store Nord indicates a bearish outlook for the company’s stock. We believe that GN Store Nord is currently overvalued, considering its relatively low market share in a highly competitive industry. This assessment raises concerns about its ability to sustain growth and profitability in such a challenging market landscape. As an investment strategy, we have implemented a short call option for GN Store Nord. The expiration date for this option is set for 8th December 2023, providing us with a timeframe of 167 days to capitalize on our bearish view. The current spot price for GN Store Nord stands at 162.9 Kr. By selling this short call option, we have collected a premium of 2,717 Kr.Conclusion
Conclusion
Disclaimer The information set forth herein has been obtained or derived from sources generally available to the public and believed by the authors to be reliable, but the authors do not make any representation or warranty, express or implied, as to its accuracy or completeness. The information is not intended to be used as the basis of any investment decisions by any person or entity. This information does not constitute investment advice, nor is it an offer or a solicitation of an offer to buy or sell any security. This report should not be considered to be a recommendation by any individual affiliated with WUTIS – Trading and Investment Society e.V.