Navigating Europe's Financial Turbulence: Opportunities Amidst the Uncertainty
Date of publishing: 24.02.2023
Executive Summary
- Swift rate hikes and an energy crisis have put considerable pressure on the European economy.
- However, a tempering gas price caused by the mild winter, declining inflation rates and a robust labour market have raised prospects of avoiding a recession
- Market sentiment seems to be divided, with markets pricing in high risks despite responding optimistically to economic data.
- Higher policy rates have ended “TINA” – bonds are back.
- For European investors, local bonds appear more attractive due to currency risk as well as elevated hedging costs.
- IG offers more favourable conditions, having wider spreads, significantly lower default risk and a unique risk-reward positioning.
Introduction
Record inflation, interest rate hikes after years of near-zero rates, and the aftermath of the Covid pandemic: the words economic crisis and recession have dominated the media in recent months, and many believe we are heading toward disaster at top speed. But is that really the case? What does the key economic data say? What problems are we really facing? And what are the big banks expecting? This article examines the European and U.S. economies and evaluates a currently attractive investment opportunity in fixed income.
The Energy Crisis
The Russian invasion of Ukraine and the resulting political and economic tensions showed their effects, especially in the European energy market. Russia, previously the most important source of natural gas, was no longer willing to supply the promised quantities due to the sanctions imposed by the western world against them. Consequently, the price of gas skyrocketed, and so did inflation. The high gas price caused a real income hit, not only for the European industry, but also for households. Europe’s dependence on natural gas (and oil) as well as the impending winter, meant that alternative supplies of gas were needed quickly to attain independence from Russia and fossil fuels in general.
The EU's diversification away from Russian gas

In May 2022, the European Commission announced the RePowerEU plan, a plan to rapidly reduce dependence on Russian fossil fuels and fast forward the green transition. Among other things, this plan led to record LNG imports and significantly higher pipeline gas deliveries, mainly from the USA. Norway, Algeria, Qatar, and Nigeria also supplied Europe, filling the hole left by the absent of supplies from Russia. Not only were Russian gas imports cut by 80%, but gas consumption in Europe also went down by 20-25%.
European Natural Gas Storage Levels
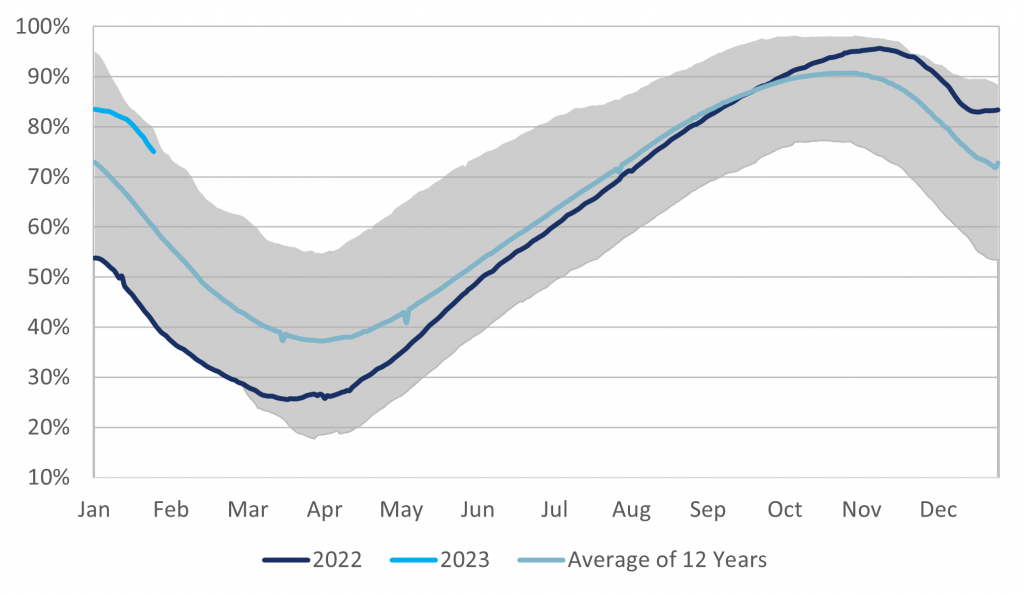
The greatly reduced dependence on Russia, the full gas storage facilities, and the so far very mild winter ensured that the gas price has fallen back to pre-Ukraine War levels, declining almost 75% from its peak. Energy storage facilities are almost full, far above the 2022 levels and close to 12-year highs. Europe is again becoming more attractive for high energy demanding industries and businesses are showing more confidence when it comes to the state of the economy – the Purchasing Managers Index still lies below 50, but in contrast to the United States, an improvement of the situation and the economic outlook are already visible. Despite that, it is still difficult to say whether the energy crisis is over. It will be crucial to start filling gas storages early enough for the next winter – the most important factors besides the weather remain the LNG availability and the Chinese demand.
Purchasing Managers‘ Index
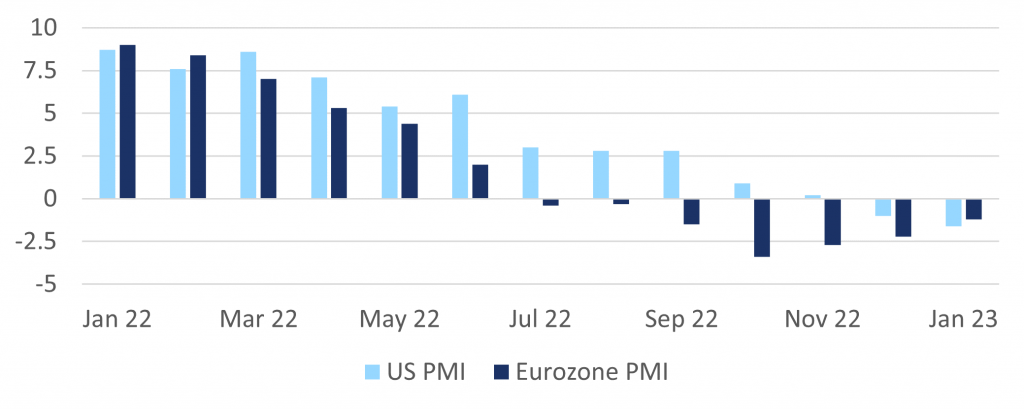
The job market displays further stability, with posted vacancies steadily increasing, unemployment decreasing and no signs of this changing. Even with substantially elevated interest rates, stable labour market performance reduces the likelihood of a recession. The Philipps curve postulates that high inflation correlates with low joblessness, which may provide an ad-hoc explanation for the current situation, though this effect is temporary. Arguing with another popular economic concept, we allude to the Beveridge curve, which relates vacancies to unemployment. By plotting these rates over time, we can conclude that there was no structural break since 2013. Neither the pandemic nor the Russian invasion of Ukraine changed the level of the curve, hence we expect the unemployment rate to contract even further. Comprising the analyses, a severe aggregated supply shock hit the European economy. A cost push affected commodity supplies and the prospect of recession was reasonable. Fortunately, Europe was spared from shortages in energy-intensive industries due to a mild winter. Gas prices decreased and the distress in the goods market may be resolved much earlier than expected. Outlooks of Goldman Sachs consider a fall of inflation in 2023 of 3% as realistic, with the main risk on electricity prices. Furthermore, a 0.6% GDP expansion is prognosticated, consistent with the assumed 0.3% growth of Deutsche Bank.
Market Sentiment Analysis
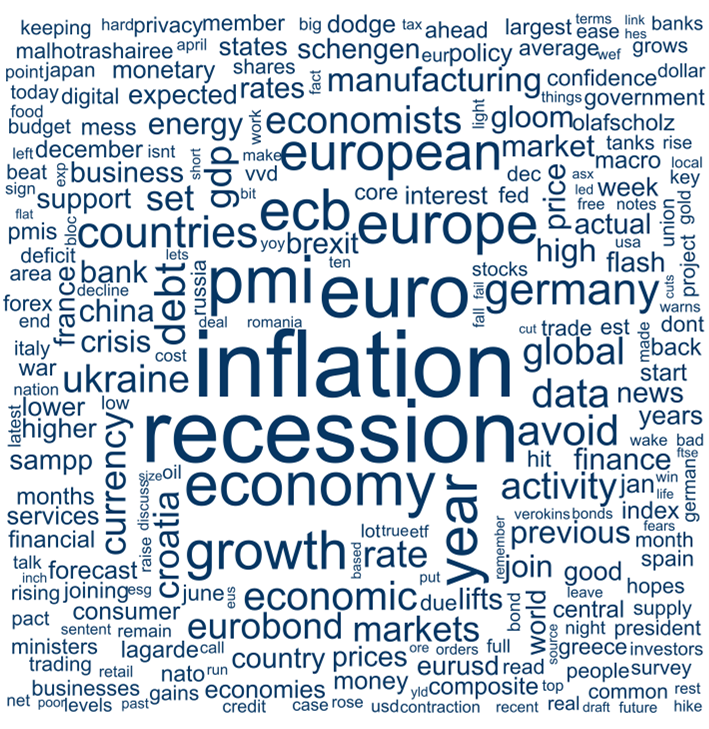
To gain insight into possible market sentiments, we use web scraping to collect the latest 2100 tweets containing the following keywords: Eurobond, Eurozone, and EUCO (the ticker of a corporate bond ETF fitting to our analysis). A word cloud depicts the most common words, omitting common stop words, and the searched keywords. The remaining terms were then analysed with the NRC sentiment dictionary created by Mohammad and Turney at the National Research Council, Canada. This dictionary is a compilation of English words and their associations with eight core emotions and two sentiments. Every word that has a sentiment assignment gets counted for each sentiment and each emotion that it is linked to. Illustrating the word counts in each category revealed it is not yet clear if the attitude is positive or negative. This brings us to the brink of determining the market potential as seen by market participants.
Web scraped tweets analysis
One of the worst years in history for portfolios
2022 has been marked by an unprecedentedly high pace of interest rate hikes in the US. In Morgan Stanley’s 2023 Global Macro outlook, it was stated that the last year has seen the fastest increase in the Federal Funds Rate since 1981, and the fastest increase in European Central Bank (ECB) rates since the establishment of the Eurozone. Contractionary monetary policy put a strong downward pressure on bond prices, ending the year-long bull run.
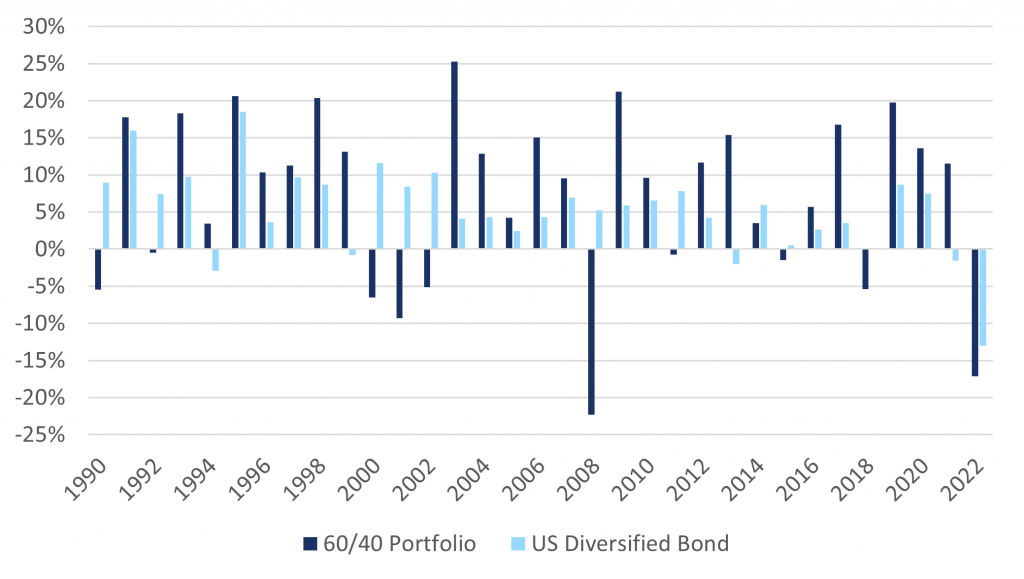
As interest rates surge, bond yields follow along, making newly released bonds more attractive compared to previously issued ones and hence reducing their price. Therefore, it is not surprising that due to extremely fast interest rate hikes almost all categories of bonds experienced a decline. This caused the Bloomberg US Aggregate Index to decline by 11%, a historical record as the index saw its harshest decline hitherto in 1994, where it fell by only 2.9%. 2022 was also exceptional year for 60/40 portfolios consisting of the MSCI World and the Global Aggregate Bond Index, as both asset classes declined simultaneously for the first time since 1980.
Annual returns for bond and 60/40 portfolios
Bonds compared to Equities
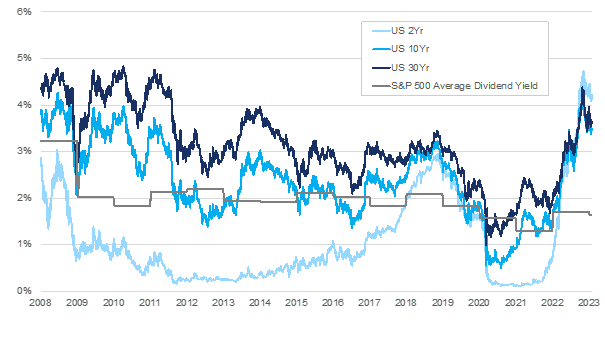
We believe that it is the right time to draw attention to bonds for several reasons. Firstly, bonds currently look more attractive than stocks as even treasury yields are higher than the average dividend yield of the S&P 500. Moreover, both real and nominal yields have reached their highest level since 2009. Secondly, the Fed hiking cycle is expected to peak in the next few months, with other central banks likely to stop raising rates. Thirdly, inflation recently started to slow down and is likely to continually do so, leading us to conclude that a reduction in risk premia or even a pivot might be expected, which would create a bullish environment for bonds.
Treasury yields against S&P 500 average dividend yield
Risk assessment
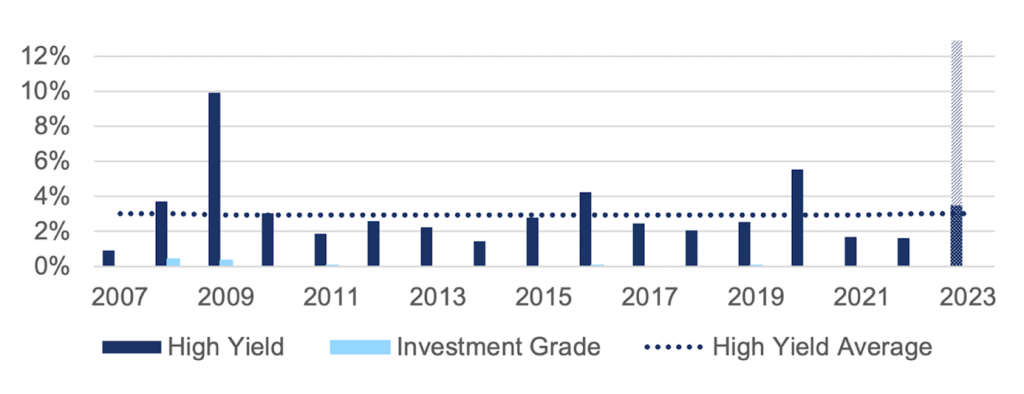
When taking a look at bond defaults, we see that delinquencies for both HY and IG bonds are currently lower than the historical average. However, HY defaults are expected to increase in 2023 and to approach this historical mark. Through yield analysis, we can approximate an implied default rate of 12.5%, which is almost 4 times higher than what we expect. Such a huge spread may be beneficial for our strategy in case the default rates stay around the average levels as we predict.
Historical bond default rates and outlook
Europe vs US
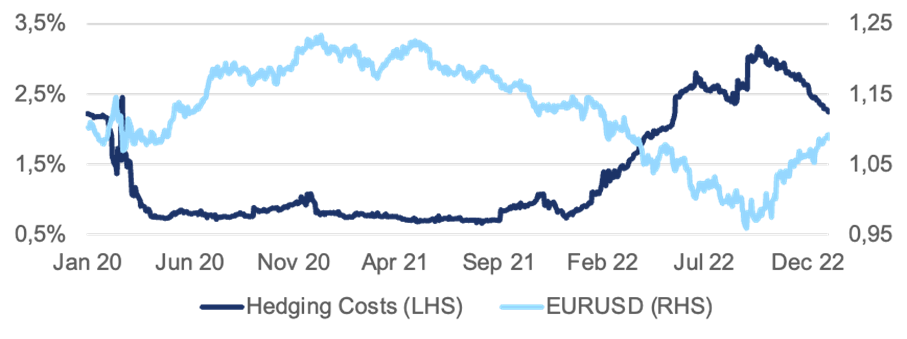
Following the fastest rate hike ever performed by the Fed and hence yields being the highest in decades, the US might seem like a great investment opportunity as bond yields have grown jointly with interest rates. Currently, US treasury yields lie between 3.5% and 4.8% – as mentioned, considerably higher than the average dividend yield for the S&P 500 of 1.64%. It might therefore be rational for a European investor to favour the US over regional opportunities. However, many investors consistently neglect the effect of currency risk and the consequent possible diminishment of returns. During 2022, we were able to experience this effect in its full power, seeing the dollar rally against basically all other currencies, leaving European investors temporarily with 10% lower returns than their US counterparts. Now, as the energy crisis in Europe seems to have been overcome (at least for now) and central banks around the world have narrowed the rate gap to the US, the dollar has lost parts of its outstanding attractiveness and begun to depreciate heavily. In times of such high Forex volatility, investors are well advised to hedge against currency risk. However, with the dollar losing value, hedging costs have surged from 0.6% to around 2.5%. Taking the comparatively low yields from bonds into account, this dramatically changes the risk-return structure for European investors and makes Eurozone bonds appear more attractive.
EUR/USD and the hedging cost
HY vs IG
We have already discussed the influence Covid-19 had on bond defaults but have not gone further into detail about how this altered the attractiveness of both High Yield and Investment Grade bonds. Noteworthy to mention is that the current spread for CDS on the two bond categories is very wide, currently sitting at 320bps. Compared to the US, where the spread is currently at 31bps, this perfectly shows how much riskier the market sees sub-investment grade bonds. Sadly, this isn’t transferred to yields and spreads. While for both, the current yield is significantly over the 3-year average, IG is considerably closer to its historically highest yield than HY. Interestingly, this also holds for the spreads: Though the current spread is above the 3-year average for both, when taking the 25-year average, only investment-grade bonds have the upper hand. Taking this top-down view into account, this hence implies a strongly favourable position for IG over HY.
Yield & Spread Analysis

Conclusion
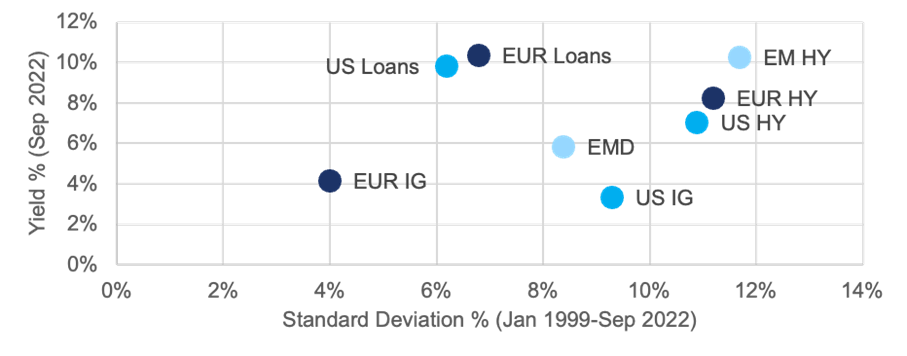
The European energy crisis and 40-year high inflation have caused fears of recession, but Europe seems to be in a better shape than the markets have expected. Strong labour markets, a rapid reduction in gas prices and an already up trending PMI signal that the EU could get away without a recession, which is also what the major institutions expect. Market sentiment is rather indecisive, which leaves room for investors to profit from this uncertainty. European investment grade bonds are thus attractive for regional investors. High currency volatility and the consequent risk is expensive to hedge, which lowers the attractiveness of the high nominal yields that can be expected in the US. Moreover, all three – yields, spreads and CDS – suggest a more advantageous positioning for investment grade. Ultimately, this creates a unique positioning for Euro IG, which is also suitably shown in a risk-return diagram. Having various bond categories clustered together, investment grade is in an exclusive space, delivering comparatively high returns with by far the lowest standard deviation. This fits together superbly with the previous analysis and exquisitely sums up why IG bonds are currently an asset worthy to invest in.
Risk-return structure of various bond types
Disclaimer The information set forth herein has been obtained or derived from sources generally available to the public and believed by the authors to be reliable, but the authors do not make any representation or warranty, express or implied, as to its accuracy or completeness. The information is not intended to be used as the basis of any investment decisions by any person or entity. This information does not constitute investment advice, nor is it an offer or a solicitation of an offer to buy or sell any security. This report should not be considered to be a recommendation by any individual affiliated with WUTIS – Trading and Investment Society e.V.