Exploring the Economic Landscape of Japan
Date of publishing: 20.02.2023
Executive Summary
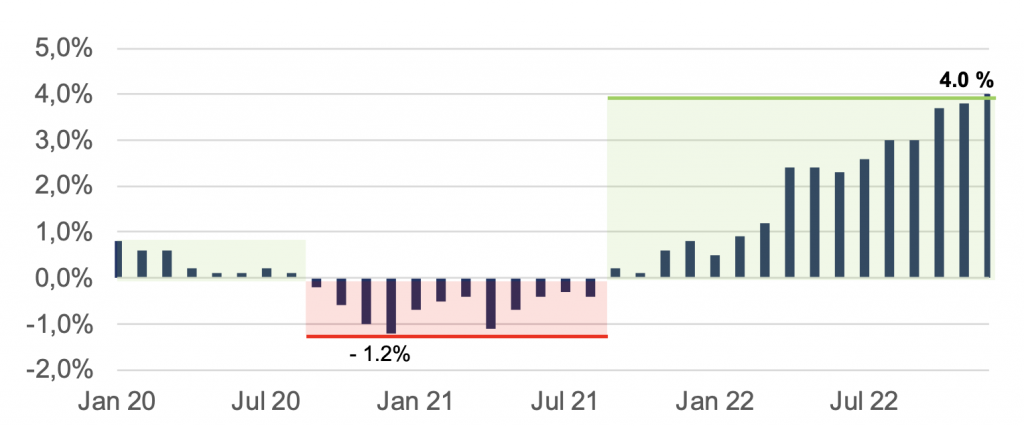
- Japanese inflation is at the highest rate since 1981
- Commodity import prices rocketed over the past year, putting pressure on the economy
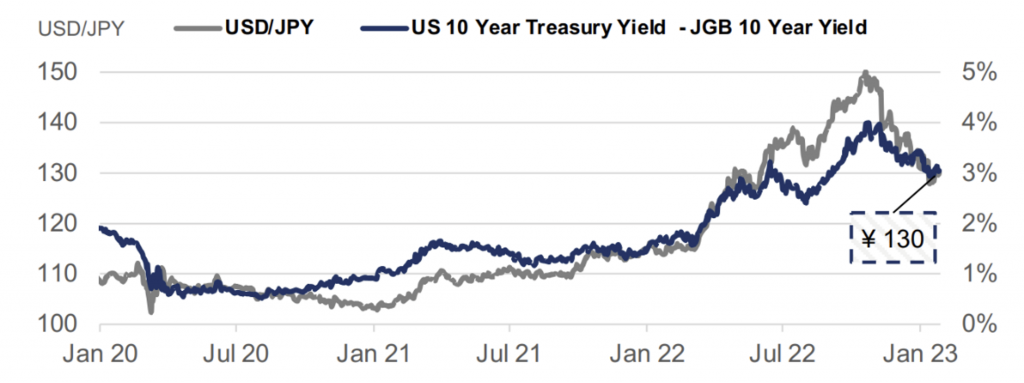
- Yield curve control mechanism broke through the 0.50% target peg in January 2023
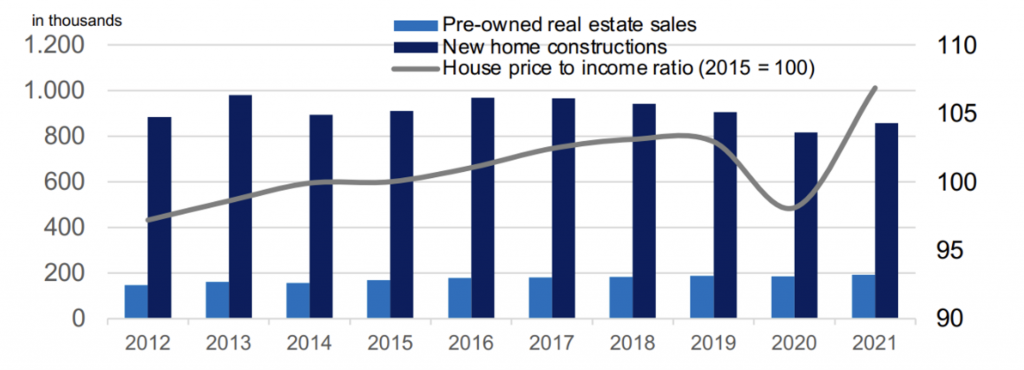
- Mortgage rates are still low, whilst home supply and prices increase
Country Overview
Japanese Industry
There are few economies in the world that can be compared to the Japanese. For one, the cooperation between governments and firms is very strong. Moreover, Japan implemented a system called “Keiretsu” which intends to promote long-term stability and growth through cooperation and mutual support among its member companies. When working together, participating entities can reduce risks, share resources, and access new markets, which can lead to increased competitiveness and profitability. While “Keiretsu” can offer many benefits, it can also be exclusionary and limit competition, which has been a subject of controversy over the past years.
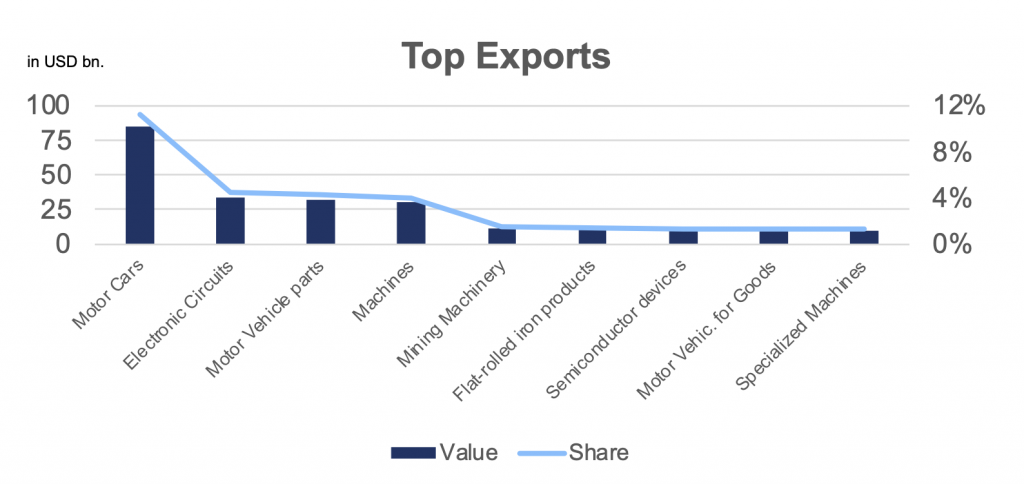
Japan is home to many globally significant enterprises, mainly across the following industries: Automobiles, Consumer Electronics, Computers, Semiconductors and Copper, Iron and Steel manufacturing.
Economic Overview
Snapshot of GDP
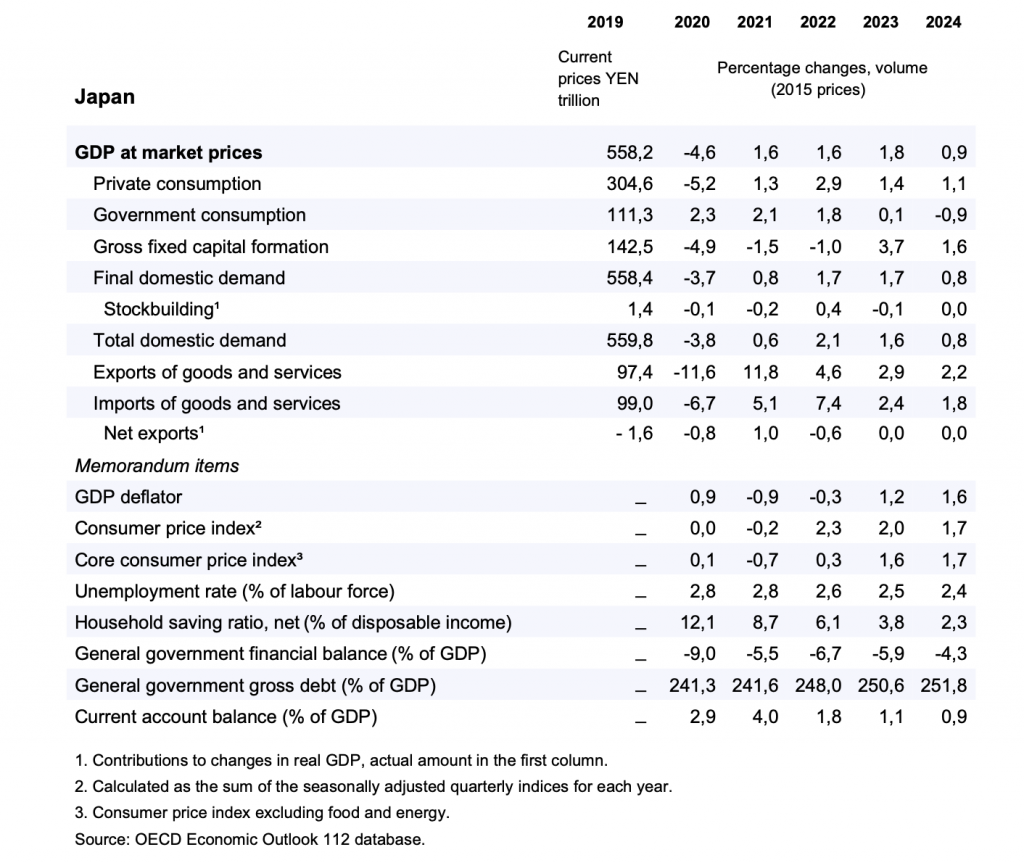
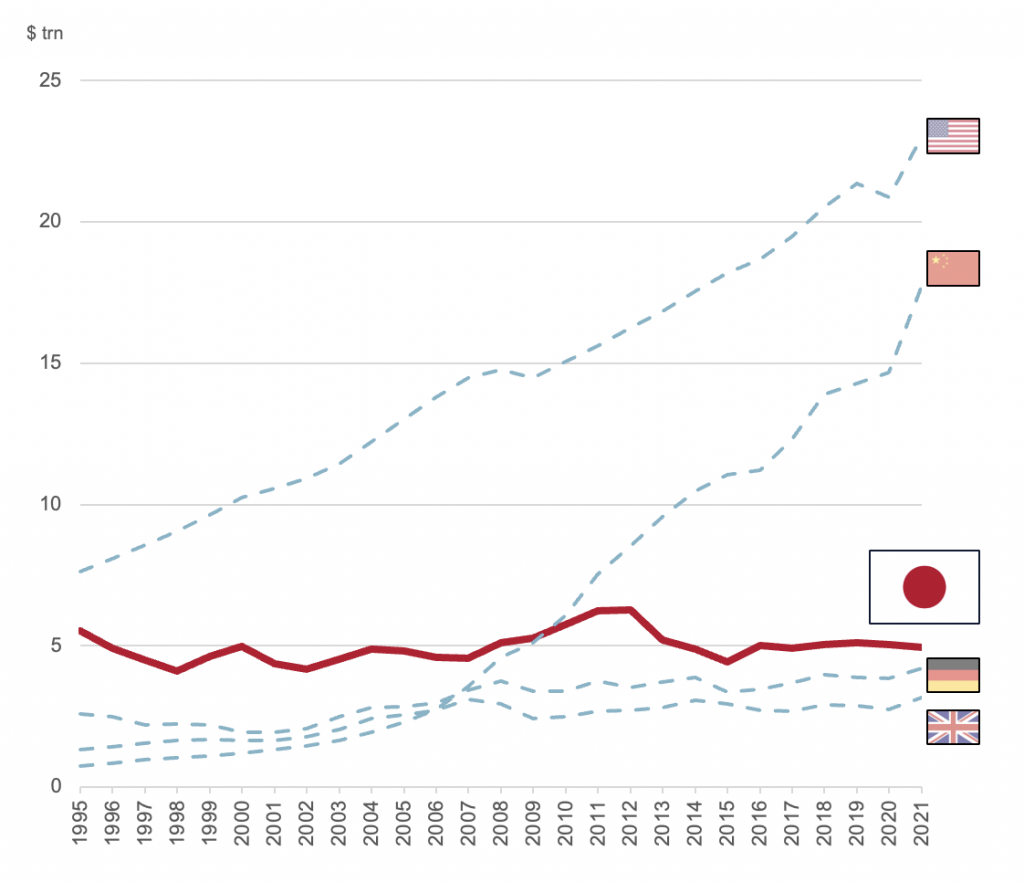
Japan, like most developed countries, has faced certain difficulties and issues over the last years that significantly impacted its economic development. In the context of the COVID-19 outbreak in 2020, Japan was one of the countries that reacted in a mostly organized and cautious way, given the experience with previous epidemics. However, this did not prevent their economy from being largely affected by a global shift in demand and consumption as well as severe supply chain issues. This means that GDP dropped by 4.6% in 2020 and slightly grew again by 1.6% in 2021.
While imports and exports traditionally had been in a somewhat even relation to one another, Japan has now been confronted with a negative foreign trade balance despite the rather weak yen. Looking at the domestic demand, consumption has taken up again and is expected to further increase in the following time. This may also correspond with a decreasing household savings ratio that had risen during pandemic times, when restrictions on public life led to less spending.
The Labour Market Trap

The Fiscal Policy Trap
Inflationary Pressure
Inflation History
Current Situation
Monetary Policy
Since 2016, the Bank of Japan is making use of the yield curve control (YCC) mechanism with the aim to peg the 10-year government bonds at 0%. But the BoJ changed the peg target from 0% to 0.5% for 10-year government bonds, along with a negative short-term benchmark rate as high as -0.1%, even though inflation keeps surging to the fastest since decades. In Figure 5 the yield of the 10-year Japanese government bond is compared to the 10-year yields of the US, UK, and Germany. It is noteworthy that the yields of US, UK and German bonds rallied during the plotted timeframe, whereas the yield of Japanese bonds remained at levels between 0% to 0.5% given the YCC mechanism of the Bank of Japan.
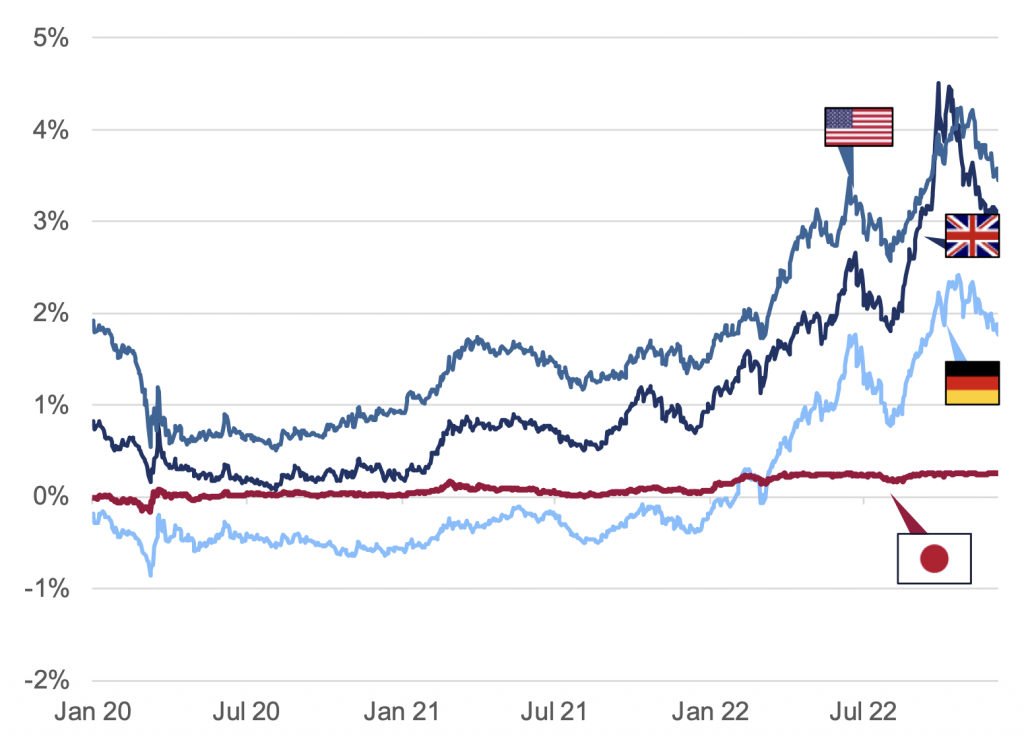
The Japanese central bank owns 73% of debt due in 7 to 10 years, which is up from 55% compared to the end of the year 2021. This creates troubles for liquidity, for example the benchmark 10-year government bond was untraded for four straight sessions in October, which was the longest run since 1999 and this might strengthen bets for a shift in the current YCC policy. With its ongoing purchases of government bonds, the BoJ is reaching “near-full” ownership, meaning these bonds will stop trading in their entirety and the market will simply cease to exist.
As mentioned before, the current governor of the BoJ stated, with respect to the current levels of inflation, that these price gains are not sustainable and are only temporarily being propelled by energy and other costs. But it is important to note that these pressures are not only coming from inflation, but also from a rapidly decreasing yen. Two reasons why the BoJ doesn’t want to change its current policy path are because they think it’s too early with respect to shortcomings of the Covid-19 pandemic but also out of fear about the deflationary era in Japan.
Japanese retail foreign currency deposits at domestic banks rose to $182bn at the end of August, up 8.3% since the start of the year. That was the largest YTD August increase since 2015. This is very unusual, because normally Japanese investors tend to buy foreign currency when the yen is strong and sell when it is weak. The huge build-up of non-yen deposits is another wave of cash that could potentially lift the yen in a more favourable domestic interest rate environment.
Current Measures
The BoJ’s grip on the sovereign debt market is growing as it continues to ramp up purchases to keep yields within a targeted range. In Q4 of 2022, already fighting for months to control the yield curve, the BoJ had raised its holdings of Japanese government bonds to over $820.9bn. This is mounting fear among markets that an orderly retreat may be impossible. The BoJ is hoping that national and international outcomes will solve its most pressing problems: sizeable wage increases by Japanese companies, the onset of “good” inflation, visible stability in the yen, a soft US recession and an interest rate pivot by the Federal Reserve.
To fight the negative impact of inflation, the government unveiled a $200bn stimulus package, roughly 30% of this amount are spent on measures to fight inflation.
The question “Does Japan have to fight it alone?” is arousing, and the answer is most probably yes, because its main partners generally don’t like countries to set or influence exchange rates and want market forces to do the work. The yen’s current weakness is driven partly by a combination of continuing BoJ monetary stimulus and the Fed rate hikes. In that sense, it could be seen as a Japan-driven event, and that may weaken the case for action.
For the first time since 1998, the BoJ intervened in the USD/JPY currency market in September, the intervention took place close to the 146 level. In October the yen passed the 151 mark, which led the BoJ to conduct its biggest intervention to support the yen, worth $37bn. Compared to previous currency interventions the BoJ is now using a new playbook, before the central bank intervened in markets to weaken the yen but now it is intervening to strengthen their domestic currency. It is interesting to remember Kuroda’s statement from May, where he mentioned that it is meaningless to conduct currency interventions, which could have a short-term effect on the yen, but can’t be carried out indefinitely.
By buying yen to support the currency, liquidity is taken out of the Japanese financial system, but at the same time the BoJ is injecting liquidity through its continuing bond purchases. The widening interest rate differential between Japan and the US means few market participants are yet confident where the yen will find a natural floor.
The BoJ might see itself obligated to change their current policy path, if inflation is permanent and domestically driven, the yen keeps weakening despite currency interventions or if bonds maturing on either side of the targeted maturity now trade with yields materially higher than the cap.
"Uedanomics"
International Trade
Overview
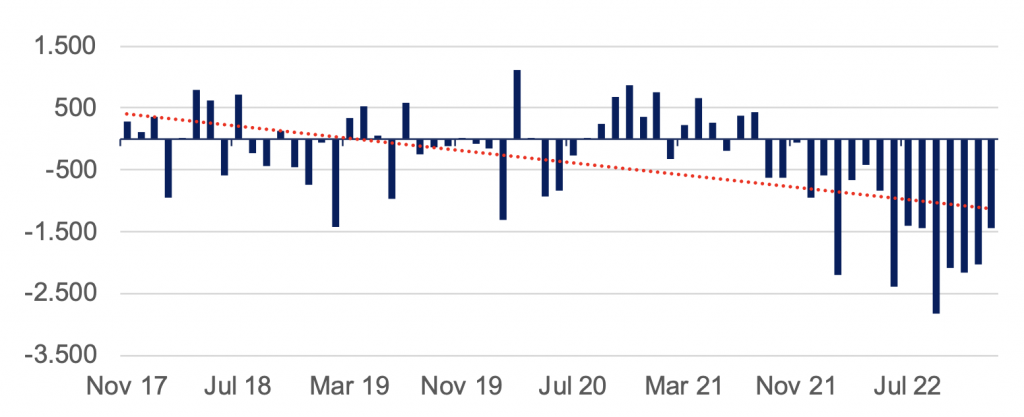
Trade Balance
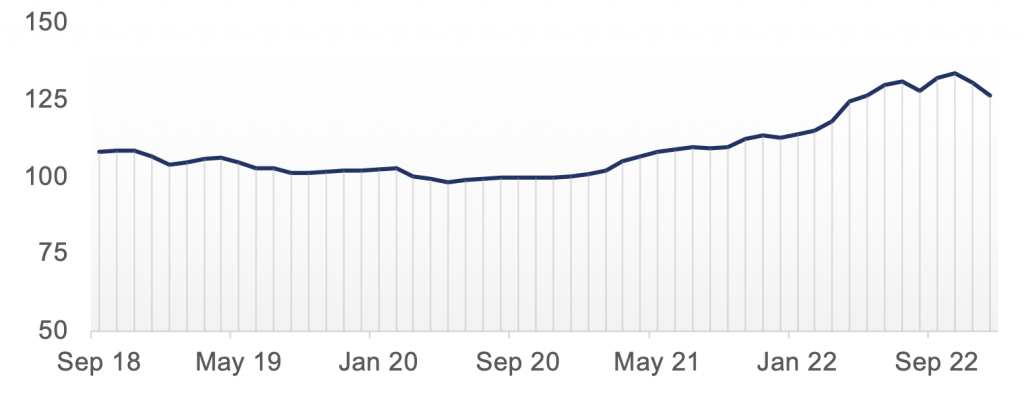
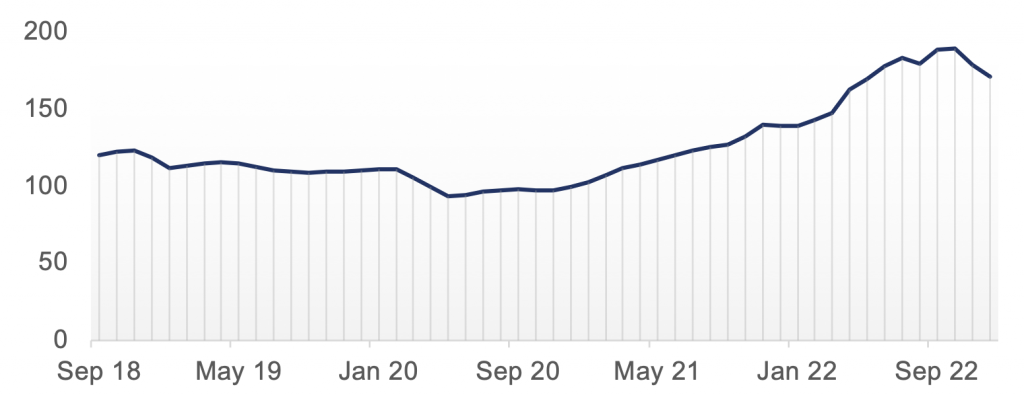
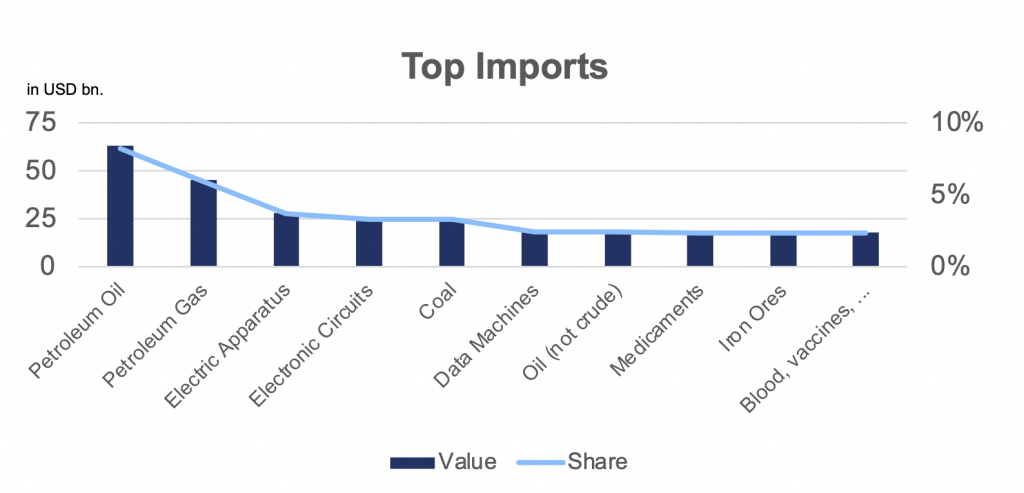
Export and Import Prices
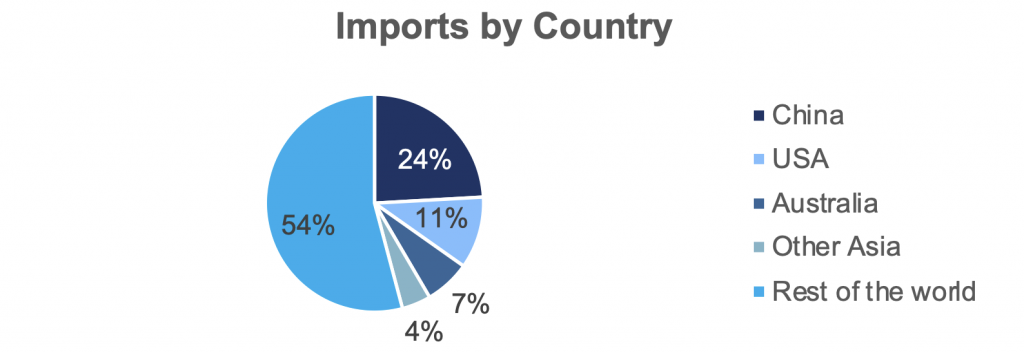
Composition of Trade

Trade Agreements
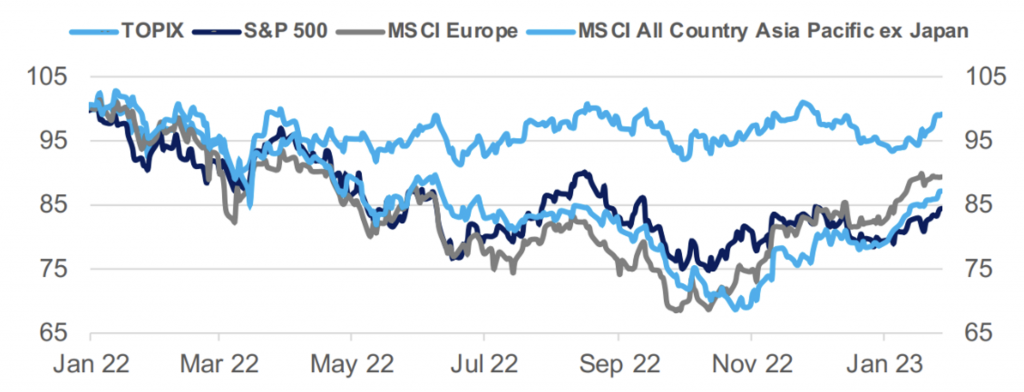
Markets
Real Estate
Disclaimer The information set forth herein has been obtained or derived from sources generally available to the public and believed by the authors to be reliable, but the authors do not make any representation or warranty, express or implied, as to its accuracy or completeness. The information is not intended to be used as the basis of any investment decisions by any person or entity. This information does not constitute investment advice, nor is it an offer or a solicitation of an offer to buy or sell any security. This report should not be considered to be a recommendation by any individual affiliated with WUTIS – Trading and Investment Society e.V.