Container Shipping: Tough Times Ahead
Date of publishing: 24.02.2023
Executive Summary
- Last quarters showed record profitability due to pandemic-related supply issues.
- Companies heavily invested their revenues to increase supply.
- Macroeconomic environment gives a weak base for global trade and demand can’t keep up with supply.
- Share prices are still above pre-pandemic levels but profits are beginning to normalize again.
Introduction
History

As visible in the chart above, one of the main factors influencing seaborne trade is economic growth. Between 2006 and 2019, the global economy experienced a number of ups and downs. For example, the global financial crisis in 2007-2009 led to a decline in economic activity, which reduced demand for shipping services and led to a decline in seaborne trade growth. Similarly, in 2011, the Euro crisis led to a slowdown of the European economy with similar downward pressures on shipping growth rates. In addition, China’s economic growth slowed significantly in 2015/16, which had a knock-on effect on global trade and the shipping industry.
Another crucial factor impacting the performance of the shipping industry is capacity. In the years leading up to the Covid-19 pandemic, the shipping industry experienced a significant surplus of capacity, particularly in 2015 and 2016. This was due in part to a slowdown in global trade and an increase in the number of ships being built. This excess capacity led to downward pressure on shipping rates, as there were more ships available to transport goods than there was demand, which reduced profitability for many shipping companies.[2]
Trade tensions between countries have a strong hold on seaborne trade growth. In 2018, the US and China imposed tariffs on each other’s goods, leading to reduced demand for their services. This trade-war disrupted shipping routes and led to uncertainty in the market, as shown through the decline in trade growth rates.[3]
Containerized Cargo Shipping
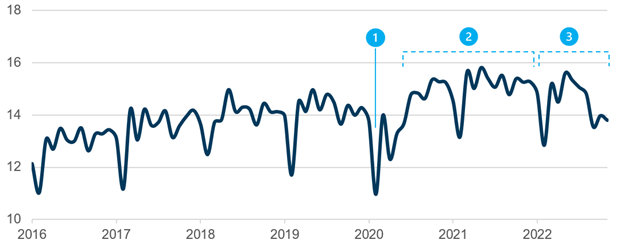
As can be seen in the chart above (1), at the start of the pandemic there was a sharp decline in global container volumes transported in the first quarter of 2020. Amid the pandemic there was overall strong growth in volumes at the end of 2020 until 2021 (2), with the exception of the strong short term drop due to the Suez Canal congestion.
Over the period of 2022 (3), there was an estimated slower growth level of global container volumes transported, with a particularly sharp decline in the beginning of 2022 due to the Russia-Ukraine war.Freight Rates
Given a weak basis from the global economic side with rising interest rates and declining growth forecasts for GDP, the effects of the current market environment should also be considered for the analysis.
Looking at monthly prices for VLSFO (Very Low Sulphur Fuel Oil) there is a steady increase since the “Covid-crash” till June 22, where prices peaked at 1,084.5 USD per metric ton[6]. During this time prices were mainly driven by inflation and conflicts between Russia and Ukraine heating up. Since the peak, prices have turned back to pre-Covid-19 levels, due to easing supply chain bottlenecks and interest rates starting to rise. However, VLSFO displays an important driver of costs for shipping companies, which are pictured by the container freight rate index below.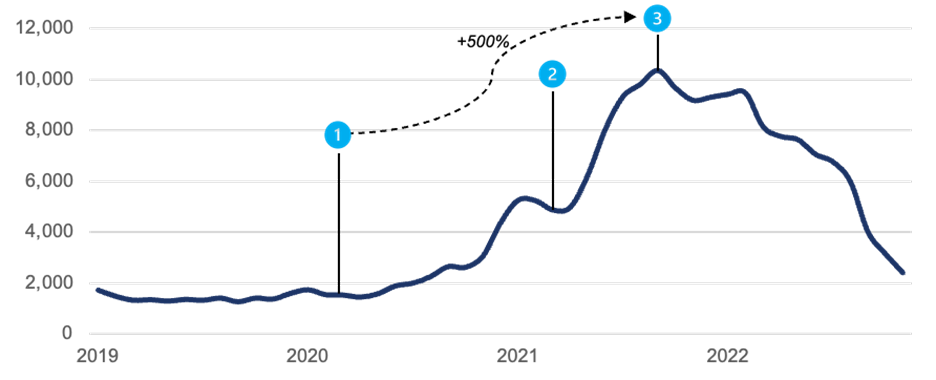
Freight rates are the costs that a party has to pay the shipping company for seaborne shipping of containerized goods. The start of Covid-19 (1) hit the shipping industry very hard. Besides rising VLSFO prices, the sector had to suffer from port closures and labor shortages. Furthermore, a stuck ship in the Suez Canal (2) had an astonishing impact on increasing freight rates, because many ships were not able to pass the canal and had to queue up or take other routes that drive costs. All these factors sum up to a peak at 10,400 USD per forty-foot equivalent (FEU). From that point on (3), many Covid-19 related issues were solved, and the labor market stabilized again. Nevertheless, firms made use of higher rates and increased their margins to generate value, which led to record high revenues for many shippers during 2022. The danish firm A.P. Møller-Maersk for example presented the highest profit of their history with a total of 29.32 bn USD in 2022.[8]
To evaluate if companies can hold these high profits, supply and demand must be analyzed further.Supply

Demand
To get a feeling for demand, container throughput of global relevant ports has to be observed. The port of Los Angeles, as well as the port of Singapore are high volume throughput locations for containerized cargo.
In Los Angeles, volumes dropped significantly for a short time at the beginning of the Covid-19 pandemic to 450 kTEU but recovered fast to levels that oscillated around 900 kTEU. Higher interest rates observed since March 2022 can definitely be a threat for demand. However, volumes seem to return to pre-Covid-19 levels.
Singapore’s container throughput has the same characteristics as Los Angeles’. Oscillating around 3,100 kTEU this port seems to be less volatile than Los Angeles’. To sum this up, demand seems to stay stable over the observed time frame. The overall demand can therefore not keep up with rising supply, which could potentially cause high costs and empty sailings for shipping companies.Peer Group
The container shipping industry has experienced a highly favorable market environment over the past year and a half. Among our peer group, of what we think are the top 10 most prominent and impactful companies in the container shipping industry, we have seen a significant increase in share prices at the onset of the pandemic, as shown in Chart 7. This rise in prices has been driven by higher container freight rates due to pandemic-related issues and supply constraints that have led to increased profitability. The mean EBITDA margins of our peer group have risen from approximately 7% to 50%.
But the past environment is over, as the latest global economic forecasts indicate tough times with declining real GDP growth in the US and Europe along with an PMI below 50 for all economies, implying contracting demand for shipping going forward. However, this isn’t the only factor influencing the company’s profitability, as the expected fleet development is resulting in an oversupply of container ships.
All this is resulting in sharply declining profitability, as EBITDA margins are expected to decline to around 10% by 2023, which will also lead to a drop in revenues.
Considering the bad outlook, the share prices of our peer group are still above pre-pandemic levels leaving downside potential for 2023. Nevertheless, stocks are trading at very low p/e ratios, which would leave us with a considerable up-side risk when taking a short position.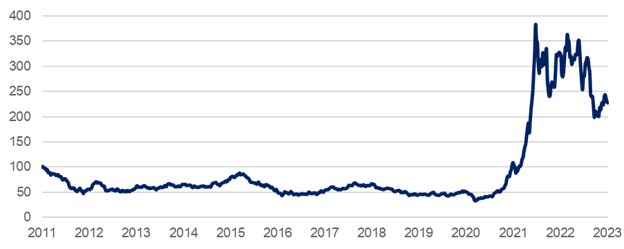

Conclusion
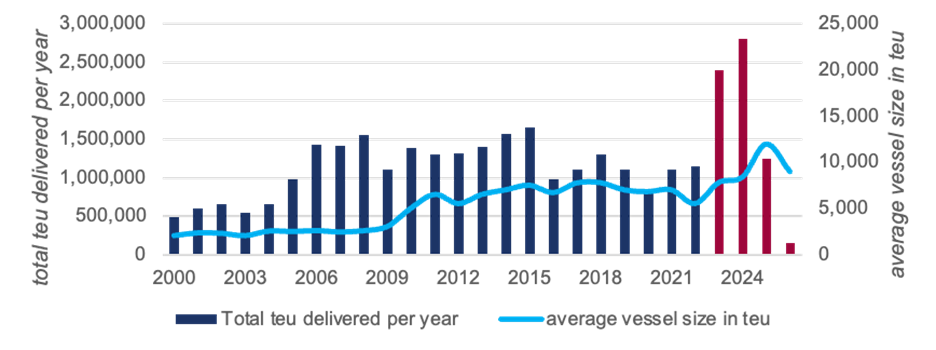
Due to high freight rates during the pandemic, companies increased margins which became visible in their recent earnings. This additional cash is used to increase supply in 2023 and 2024, by growing fleet sizes and the overall container volume of ships. However, throughput of the most important container ports show that demand is not able to keep up with fast growing supply. High supply also creates high costs, which is just one future risk for all companies in our peer group. Besides, the general macroeconomic environment does not support an increase in demand. Interest rates and declining GDP growth rates let global trade suffer.
Overall, these factors give reason to see downside potential in the shipping sector and therefore in the valuation of our peer group.Disclaimer The information set forth herein has been obtained or derived from sources generally available to the public and believed by the authors to be reliable, but the authors do not make any representation or warranty, express or implied, as to its accuracy or completeness. The information is not intended to be used as the basis of any investment decisions by any person or entity. This information does not constitute investment advice, nor is it an offer or a solicitation of an offer to buy or sell any security. This report should not be considered to be a recommendation by any individual affiliated with WUTIS – Trading and Investment Society e.V.